Profile of the Running ES Score & Positions of GeneSet Members on the Rank Ordered List
| Dataset | set03_absentNotch_versus_truncNotch |
| Phenotype | NoPhenotypeAvailable |
| Upregulated in class | na_pos |
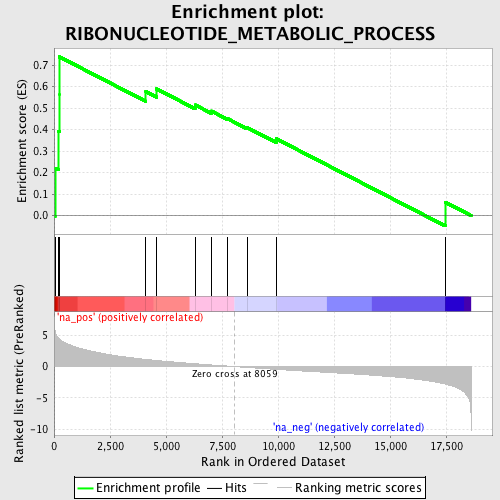
| GeneSet | RIBONUCLEOTIDE_METABOLIC_PROCESS |
| Enrichment Score (ES) | 0.738232 |
| Normalized Enrichment Score (NES) | 1.972274 |
| Nominal p-value | 0.0021645022 |
| FDR q-value | 0.018663023 |
| FWER p-Value | 0.249 |
| PROBE | GENE SYMBOL | GENE_TITLE | RANK IN GENE LIST | RANK METRIC SCORE | RUNNING ES | CORE ENRICHMENT | |
|---|---|---|---|---|---|---|---|
| 1 | ACLY | 42 | 5.627 | 0.2208 | Yes | ||
| 2 | FIGNL1 | 205 | 4.514 | 0.3911 | Yes | ||
| 3 | CTPS | 234 | 4.412 | 0.5645 | Yes | ||
| 4 | ADK | 238 | 4.388 | 0.7382 | Yes | ||
| 5 | CTNS | 4094 | 1.143 | 0.5763 | No | ||
| 6 | UMPS | 4574 | 0.972 | 0.5891 | No | ||
| 7 | NUDT5 | 6296 | 0.451 | 0.5145 | No | ||
| 8 | NDUFS1 | 7011 | 0.261 | 0.4865 | No | ||
| 9 | ENTPD4 | 7723 | 0.085 | 0.4516 | No | ||
| 10 | GUK1 | 8630 | -0.145 | 0.4087 | No | ||
| 11 | AK5 | 9917 | -0.445 | 0.3572 | No | ||
| 12 | AMPD3 | 17461 | -2.783 | 0.0621 | No |
