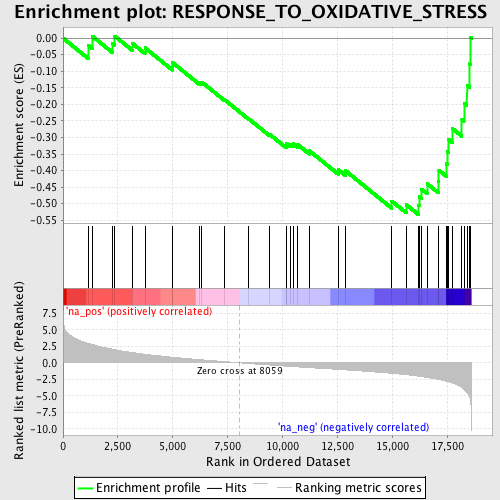
Profile of the Running ES Score & Positions of GeneSet Members on the Rank Ordered List
| Dataset | set03_absentNotch_versus_truncNotch |
| Phenotype | NoPhenotypeAvailable |
| Upregulated in class | na_neg |
| GeneSet | RESPONSE_TO_OXIDATIVE_STRESS |
| Enrichment Score (ES) | -0.5326341 |
| Normalized Enrichment Score (NES) | -1.9523795 |
| Nominal p-value | 0.0 |
| FDR q-value | 0.098926954 |
| FWER p-Value | 0.199 |
| PROBE | GENE SYMBOL | GENE_TITLE | RANK IN GENE LIST | RANK METRIC SCORE | RUNNING ES | CORE ENRICHMENT | |
|---|---|---|---|---|---|---|---|
| 1 | SEPP1 | 1156 | 2.913 | -0.0223 | No | ||
| 2 | PRNP | 1350 | 2.742 | 0.0049 | No | ||
| 3 | CCL5 | 2252 | 2.051 | -0.0155 | No | ||
| 4 | GCLM | 2353 | 1.976 | 0.0062 | No | ||
| 5 | SRXN1 | 3155 | 1.543 | -0.0158 | No | ||
| 6 | GLRX2 | 3735 | 1.282 | -0.0294 | No | ||
| 7 | NDUFA6 | 4980 | 0.841 | -0.0848 | No | ||
| 8 | CYGB | 4986 | 0.837 | -0.0736 | No | ||
| 9 | RNF7 | 6204 | 0.478 | -0.1326 | No | ||
| 10 | GCLC | 6325 | 0.445 | -0.1329 | No | ||
| 11 | SGK2 | 7334 | 0.184 | -0.1846 | No | ||
| 12 | DUSP1 | 8464 | -0.107 | -0.2440 | No | ||
| 13 | APTX | 9403 | -0.320 | -0.2901 | No | ||
| 14 | APOA4 | 10171 | -0.501 | -0.3245 | No | ||
| 15 | NUDT1 | 10193 | -0.507 | -0.3187 | No | ||
| 16 | NDUFS2 | 10380 | -0.549 | -0.3211 | No | ||
| 17 | SOD2 | 10487 | -0.572 | -0.3190 | No | ||
| 18 | NDUFB4 | 10699 | -0.619 | -0.3219 | No | ||
| 19 | ERCC3 | 11223 | -0.729 | -0.3400 | No | ||
| 20 | SOD1 | 12534 | -0.997 | -0.3969 | No | ||
| 21 | MPO | 12863 | -1.064 | -0.4000 | No | ||
| 22 | ATOX1 | 14982 | -1.587 | -0.4922 | No | ||
| 23 | PRDX5 | 15645 | -1.791 | -0.5033 | No | ||
| 24 | PRDX2 | 16191 | -2.023 | -0.5049 | Yes | ||
| 25 | PRDX6 | 16227 | -2.035 | -0.4789 | Yes | ||
| 26 | MSRA | 16343 | -2.086 | -0.4565 | Yes | ||
| 27 | SCARA3 | 16590 | -2.210 | -0.4395 | Yes | ||
| 28 | ERCC2 | 17101 | -2.512 | -0.4325 | Yes | ||
| 29 | ERCC8 | 17130 | -2.534 | -0.3993 | Yes | ||
| 30 | DHCR24 | 17466 | -2.791 | -0.3791 | Yes | ||
| 31 | PDLIM1 | 17523 | -2.838 | -0.3432 | Yes | ||
| 32 | NDUFS8 | 17572 | -2.883 | -0.3063 | Yes | ||
| 33 | GPX3 | 17753 | -3.079 | -0.2737 | Yes | ||
| 34 | GSS | 18177 | -3.726 | -0.2454 | Yes | ||
| 35 | STK25 | 18272 | -3.986 | -0.1959 | Yes | ||
| 36 | ERCC1 | 18408 | -4.452 | -0.1421 | Yes | ||
| 37 | TXNRD2 | 18529 | -5.172 | -0.0777 | Yes | ||
| 38 | PNKP | 18580 | -6.008 | 0.0019 | Yes |
