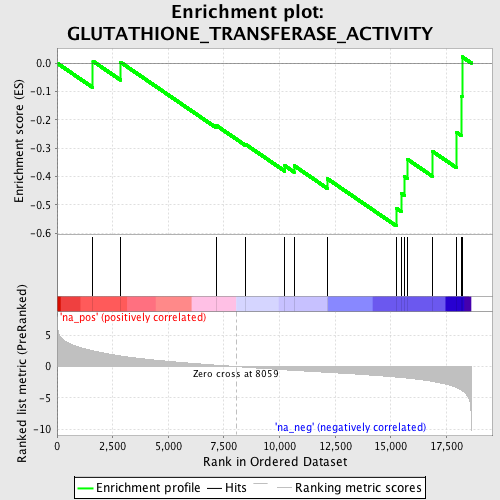
Profile of the Running ES Score & Positions of GeneSet Members on the Rank Ordered List
| Dataset | set03_absentNotch_versus_truncNotch |
| Phenotype | NoPhenotypeAvailable |
| Upregulated in class | na_neg |
| GeneSet | GLUTATHIONE_TRANSFERASE_ACTIVITY |
| Enrichment Score (ES) | -0.5742967 |
| Normalized Enrichment Score (NES) | -1.6123147 |
| Nominal p-value | 0.011450382 |
| FDR q-value | 0.43632478 |
| FWER p-Value | 1.0 |

| PROBE | GENE SYMBOL | GENE_TITLE | RANK IN GENE LIST | RANK METRIC SCORE | RUNNING ES | CORE ENRICHMENT | |
|---|---|---|---|---|---|---|---|
| 1 | GSTM5 | 1612 | 2.501 | 0.0067 | No | ||
| 2 | MGST3 | 2852 | 1.686 | 0.0030 | No | ||
| 3 | GSTM3 | 7145 | 0.226 | -0.2193 | No | ||
| 4 | GSTA3 | 8484 | -0.111 | -0.2871 | No | ||
| 5 | MGST1 | 10234 | -0.514 | -0.3619 | No | ||
| 6 | LTC4S | 10653 | -0.610 | -0.3616 | No | ||
| 7 | GSTA2 | 12152 | -0.917 | -0.4079 | No | ||
| 8 | GSTM2 | 15248 | -1.669 | -0.5120 | Yes | ||
| 9 | GSTM1 | 15467 | -1.735 | -0.4590 | Yes | ||
| 10 | GSTZ1 | 15621 | -1.782 | -0.4007 | Yes | ||
| 11 | GSTT1 | 15741 | -1.833 | -0.3387 | Yes | ||
| 12 | GSTA4 | 16884 | -2.371 | -0.3117 | Yes | ||
| 13 | MGST2 | 17963 | -3.350 | -0.2446 | Yes | ||
| 14 | GSTT2 | 18164 | -3.704 | -0.1172 | Yes | ||
| 15 | GSTM4 | 18206 | -3.789 | 0.0220 | Yes |
