Profile of the Running ES Score & Positions of GeneSet Members on the Rank Ordered List
| Dataset | set03_absentNotch_versus_truncNotch |
| Phenotype | NoPhenotypeAvailable |
| Upregulated in class | na_neg |
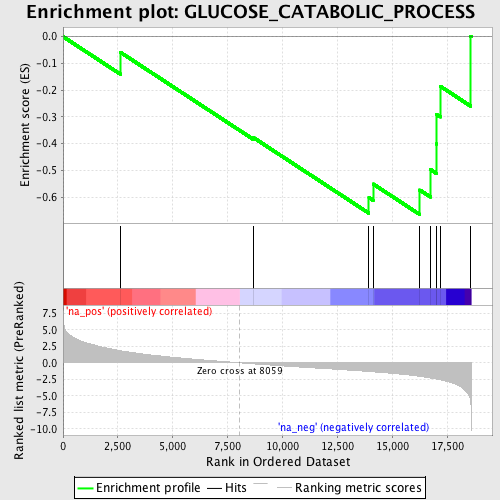
| GeneSet | GLUCOSE_CATABOLIC_PROCESS |
| Enrichment Score (ES) | -0.66486734 |
| Normalized Enrichment Score (NES) | -1.6757485 |
| Nominal p-value | 0.0114068445 |
| FDR q-value | 0.32039943 |
| FWER p-Value | 0.998 |
| PROBE | GENE SYMBOL | GENE_TITLE | RANK IN GENE LIST | RANK METRIC SCORE | RUNNING ES | CORE ENRICHMENT | |
|---|---|---|---|---|---|---|---|
| 1 | TKTL1 | 2620 | 1.828 | -0.0589 | No | ||
| 2 | ALDOB | 8667 | -0.153 | -0.3770 | No | ||
| 3 | HK1 | 13939 | -1.314 | -0.6014 | Yes | ||
| 4 | PGLS | 14131 | -1.359 | -0.5508 | Yes | ||
| 5 | PFKL | 16255 | -2.045 | -0.5733 | Yes | ||
| 6 | GAPDHS | 16749 | -2.293 | -0.4971 | Yes | ||
| 7 | PFKFB1 | 17007 | -2.453 | -0.4010 | Yes | ||
| 8 | PFKM | 17018 | -2.460 | -0.2913 | Yes | ||
| 9 | PGD | 17188 | -2.571 | -0.1852 | Yes | ||
| 10 | ALDOA | 18577 | -5.848 | 0.0021 | Yes |
