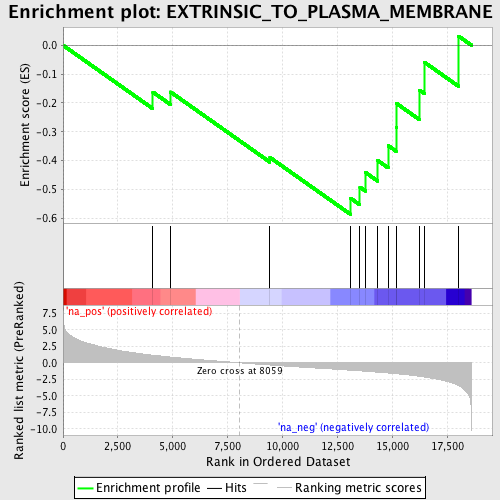
Profile of the Running ES Score & Positions of GeneSet Members on the Rank Ordered List
| Dataset | set03_absentNotch_versus_truncNotch |
| Phenotype | NoPhenotypeAvailable |
| Upregulated in class | na_neg |
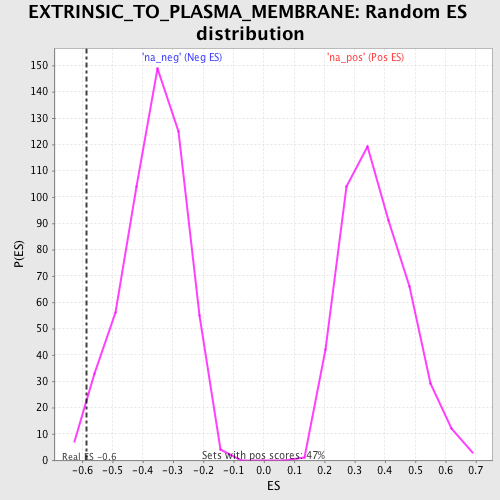
| GeneSet | EXTRINSIC_TO_PLASMA_MEMBRANE |
| Enrichment Score (ES) | -0.58676094 |
| Normalized Enrichment Score (NES) | -1.6148378 |
| Nominal p-value | 0.016885553 |
| FDR q-value | 0.4507455 |
| FWER p-Value | 1.0 |
| PROBE | GENE SYMBOL | GENE_TITLE | RANK IN GENE LIST | RANK METRIC SCORE | RUNNING ES | CORE ENRICHMENT | |
|---|---|---|---|---|---|---|---|
| 1 | GNAI1 | 4092 | 1.143 | -0.1623 | No | ||
| 2 | TDGF1 | 4898 | 0.867 | -0.1619 | No | ||
| 3 | GNA14 | 9425 | -0.324 | -0.3888 | No | ||
| 4 | TGM3 | 13108 | -1.113 | -0.5307 | Yes | ||
| 5 | RGS19 | 13528 | -1.214 | -0.4920 | Yes | ||
| 6 | SCUBE1 | 13783 | -1.279 | -0.4412 | Yes | ||
| 7 | SYTL1 | 14339 | -1.415 | -0.3997 | Yes | ||
| 8 | EEA1 | 14816 | -1.536 | -0.3478 | Yes | ||
| 9 | SYTL4 | 15180 | -1.647 | -0.2843 | Yes | ||
| 10 | SYTL2 | 15197 | -1.656 | -0.2017 | Yes | ||
| 11 | ARRB1 | 16249 | -2.043 | -0.1552 | Yes | ||
| 12 | APC2 | 16481 | -2.150 | -0.0593 | Yes | ||
| 13 | GNAS | 18022 | -3.452 | 0.0319 | Yes |