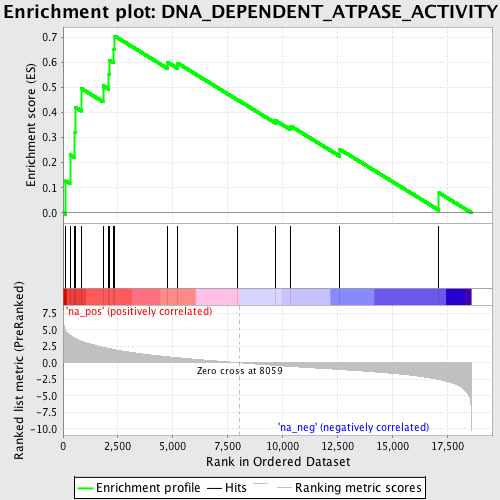
Profile of the Running ES Score & Positions of GeneSet Members on the Rank Ordered List
| Dataset | set03_absentNotch_versus_truncNotch |
| Phenotype | NoPhenotypeAvailable |
| Upregulated in class | na_pos |
| GeneSet | DNA_DEPENDENT_ATPASE_ACTIVITY |
| Enrichment Score (ES) | 0.7040835 |
| Normalized Enrichment Score (NES) | 2.086061 |
| Nominal p-value | 0.0 |
| FDR q-value | 0.013993137 |
| FWER p-Value | 0.061 |
| PROBE | GENE SYMBOL | GENE_TITLE | RANK IN GENE LIST | RANK METRIC SCORE | RUNNING ES | CORE ENRICHMENT | |
|---|---|---|---|---|---|---|---|
| 1 | G3BP1 | 117 | 4.877 | 0.1272 | Yes | ||
| 2 | CHD4 | 314 | 4.175 | 0.2310 | Yes | ||
| 3 | XRCC6 | 540 | 3.704 | 0.3203 | Yes | ||
| 4 | CHD1 | 549 | 3.690 | 0.4210 | Yes | ||
| 5 | RECQL | 834 | 3.270 | 0.4952 | Yes | ||
| 6 | DHX9 | 1822 | 2.348 | 0.5064 | Yes | ||
| 7 | RAD51 | 2089 | 2.166 | 0.5514 | Yes | ||
| 8 | TOP2A | 2126 | 2.130 | 0.6078 | Yes | ||
| 9 | RFC3 | 2315 | 2.003 | 0.6525 | Yes | ||
| 10 | BPTF | 2361 | 1.971 | 0.7041 | Yes | ||
| 11 | CHD2 | 4771 | 0.907 | 0.5994 | No | ||
| 12 | SMARCA1 | 5211 | 0.772 | 0.5969 | No | ||
| 13 | XRCC5 | 7947 | 0.028 | 0.4507 | No | ||
| 14 | RUVBL2 | 9685 | -0.387 | 0.3679 | No | ||
| 15 | SMARCAL1 | 10376 | -0.547 | 0.3458 | No | ||
| 16 | RBBP4 | 12609 | -1.014 | 0.2535 | No | ||
| 17 | ERCC8 | 17130 | -2.534 | 0.0799 | No |
