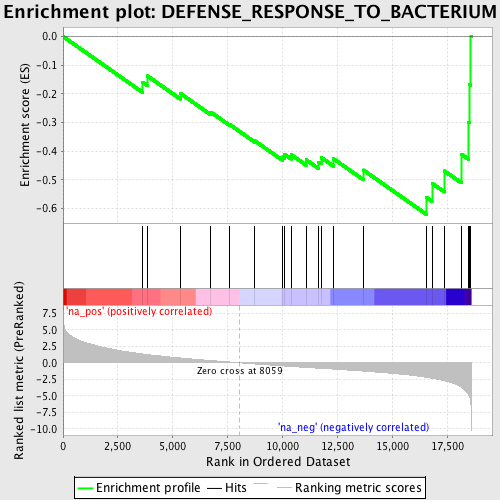
Profile of the Running ES Score & Positions of GeneSet Members on the Rank Ordered List
| Dataset | set03_absentNotch_versus_truncNotch |
| Phenotype | NoPhenotypeAvailable |
| Upregulated in class | na_neg |
| GeneSet | DEFENSE_RESPONSE_TO_BACTERIUM |
| Enrichment Score (ES) | -0.62053424 |
| Normalized Enrichment Score (NES) | -1.9019415 |
| Nominal p-value | 0.0035778175 |
| FDR q-value | 0.072522394 |
| FWER p-Value | 0.39 |
| PROBE | GENE SYMBOL | GENE_TITLE | RANK IN GENE LIST | RANK METRIC SCORE | RUNNING ES | CORE ENRICHMENT | |
|---|---|---|---|---|---|---|---|
| 1 | IL12A | 3634 | 1.327 | -0.1596 | No | ||
| 2 | CFP | 3841 | 1.238 | -0.1373 | No | ||
| 3 | PGLYRP3 | 5343 | 0.730 | -0.1984 | No | ||
| 4 | NLRC4 | 6721 | 0.342 | -0.2632 | No | ||
| 5 | NOD2 | 7603 | 0.116 | -0.3074 | No | ||
| 6 | STAB2 | 8742 | -0.171 | -0.3640 | No | ||
| 7 | STAB1 | 10019 | -0.468 | -0.4200 | No | ||
| 8 | LALBA | 10102 | -0.489 | -0.4112 | No | ||
| 9 | TLR3 | 10401 | -0.553 | -0.4124 | No | ||
| 10 | WFDC12 | 11074 | -0.697 | -0.4297 | No | ||
| 11 | PGLYRP1 | 11647 | -0.818 | -0.4384 | No | ||
| 12 | SPACA3 | 11761 | -0.838 | -0.4219 | No | ||
| 13 | DEFB103A | 12326 | -0.954 | -0.4265 | No | ||
| 14 | CAMP | 13679 | -1.252 | -0.4654 | No | ||
| 15 | DEFB127 | 16565 | -2.195 | -0.5613 | Yes | ||
| 16 | TLR6 | 16815 | -2.332 | -0.5118 | Yes | ||
| 17 | DMBT1 | 17381 | -2.724 | -0.4687 | Yes | ||
| 18 | PGLYRP4 | 18154 | -3.688 | -0.4108 | Yes | ||
| 19 | NOD1 | 18468 | -4.780 | -0.2987 | Yes | ||
| 20 | SPN | 18507 | -4.985 | -0.1662 | Yes | ||
| 21 | PGLYRP2 | 18589 | -6.378 | 0.0015 | Yes |
