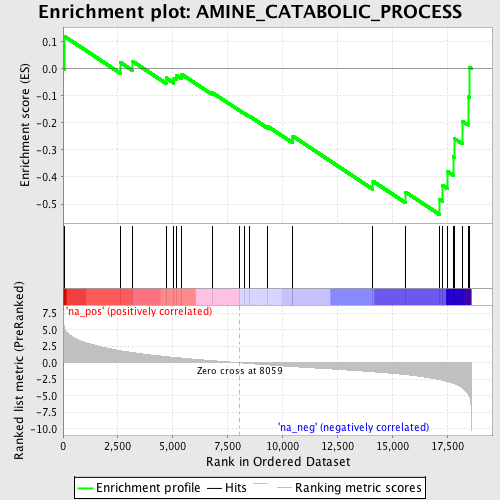
Profile of the Running ES Score & Positions of GeneSet Members on the Rank Ordered List
| Dataset | set03_absentNotch_versus_truncNotch |
| Phenotype | NoPhenotypeAvailable |
| Upregulated in class | na_neg |
| GeneSet | AMINE_CATABOLIC_PROCESS |
| Enrichment Score (ES) | -0.53872335 |
| Normalized Enrichment Score (NES) | -1.7445205 |
| Nominal p-value | 0.0053956835 |
| FDR q-value | 0.2105522 |
| FWER p-Value | 0.945 |
| PROBE | GENE SYMBOL | GENE_TITLE | RANK IN GENE LIST | RANK METRIC SCORE | RUNNING ES | CORE ENRICHMENT | |
|---|---|---|---|---|---|---|---|
| 1 | GLUD1 | 46 | 5.556 | 0.1208 | No | ||
| 2 | GLDC | 2617 | 1.833 | 0.0233 | No | ||
| 3 | GAD1 | 3169 | 1.537 | 0.0277 | No | ||
| 4 | FAH | 4694 | 0.935 | -0.0335 | No | ||
| 5 | GAD2 | 5052 | 0.818 | -0.0345 | No | ||
| 6 | ASRGL1 | 5175 | 0.780 | -0.0238 | No | ||
| 7 | ARG1 | 5400 | 0.712 | -0.0201 | No | ||
| 8 | HGD | 6789 | 0.324 | -0.0875 | No | ||
| 9 | DDAH2 | 8031 | 0.006 | -0.1541 | No | ||
| 10 | HPD | 8269 | -0.052 | -0.1657 | No | ||
| 11 | BCKDHB | 8498 | -0.114 | -0.1754 | No | ||
| 12 | INDO | 9335 | -0.306 | -0.2136 | No | ||
| 13 | MCCC2 | 10465 | -0.569 | -0.2617 | No | ||
| 14 | ASPA | 10473 | -0.570 | -0.2494 | No | ||
| 15 | DDAH1 | 14122 | -1.358 | -0.4155 | No | ||
| 16 | GSTZ1 | 15621 | -1.782 | -0.4565 | No | ||
| 17 | DHPS | 17150 | -2.546 | -0.4822 | Yes | ||
| 18 | BCKDHA | 17300 | -2.661 | -0.4312 | Yes | ||
| 19 | ALDH4A1 | 17516 | -2.830 | -0.3800 | Yes | ||
| 20 | AMT | 17782 | -3.105 | -0.3253 | Yes | ||
| 21 | BCKDK | 17820 | -3.150 | -0.2574 | Yes | ||
| 22 | GOT2 | 18197 | -3.766 | -0.1941 | Yes | ||
| 23 | ASL | 18456 | -4.682 | -0.1040 | Yes | ||
| 24 | GOT1 | 18519 | -5.074 | 0.0052 | Yes |
