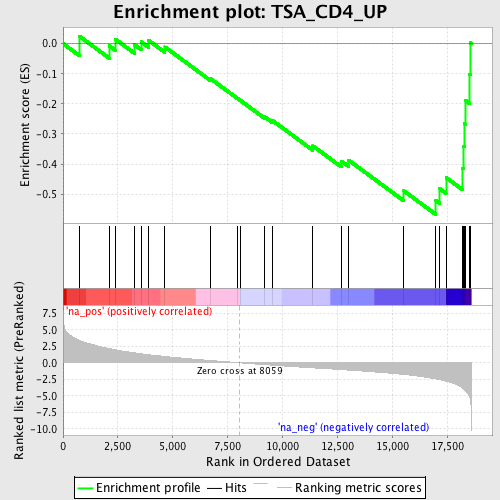
Profile of the Running ES Score & Positions of GeneSet Members on the Rank Ordered List
| Dataset | set03_absentNotch_versus_truncNotch |
| Phenotype | NoPhenotypeAvailable |
| Upregulated in class | na_neg |
| GeneSet | TSA_CD4_UP |
| Enrichment Score (ES) | -0.5676161 |
| Normalized Enrichment Score (NES) | -1.8362262 |
| Nominal p-value | 0.0 |
| FDR q-value | 0.08910822 |
| FWER p-Value | 0.739 |
| PROBE | GENE SYMBOL | GENE_TITLE | RANK IN GENE LIST | RANK METRIC SCORE | RUNNING ES | CORE ENRICHMENT | |
|---|---|---|---|---|---|---|---|
| 1 | EIF4A1 | 736 | 3.409 | 0.0251 | No | ||
| 2 | YWHAH | 2097 | 2.160 | -0.0070 | No | ||
| 3 | HSP90AB1 | 2397 | 1.954 | 0.0140 | No | ||
| 4 | HMGN1 | 3257 | 1.500 | -0.0037 | No | ||
| 5 | FKBP4 | 3559 | 1.363 | 0.0060 | No | ||
| 6 | TMSB4X | 3891 | 1.219 | 0.0113 | No | ||
| 7 | MYC | 4642 | 0.949 | -0.0110 | No | ||
| 8 | SSR4 | 6730 | 0.339 | -0.1168 | No | ||
| 9 | ENO2 | 7949 | 0.027 | -0.1818 | No | ||
| 10 | RARA | 8075 | -0.004 | -0.1885 | No | ||
| 11 | BYSL | 9175 | -0.274 | -0.2424 | No | ||
| 12 | IGFBP4 | 9525 | -0.349 | -0.2545 | No | ||
| 13 | TGFB1 | 11383 | -0.765 | -0.3399 | No | ||
| 14 | PA2G4 | 12679 | -1.028 | -0.3900 | No | ||
| 15 | PSMB4 | 13015 | -1.095 | -0.3873 | No | ||
| 16 | ITGB4BP | 15532 | -1.753 | -0.4893 | No | ||
| 17 | TP53 | 16989 | -2.442 | -0.5213 | Yes | ||
| 18 | COX8A | 17167 | -2.559 | -0.4822 | Yes | ||
| 19 | MIF | 17454 | -2.776 | -0.4449 | Yes | ||
| 20 | USF2 | 18214 | -3.794 | -0.4137 | Yes | ||
| 21 | CD2 | 18264 | -3.962 | -0.3411 | Yes | ||
| 22 | BAK1 | 18294 | -4.051 | -0.2657 | Yes | ||
| 23 | STRA13 | 18333 | -4.174 | -0.1885 | Yes | ||
| 24 | CD82 | 18525 | -5.141 | -0.1012 | Yes | ||
| 25 | CD6 | 18561 | -5.587 | 0.0030 | Yes |
