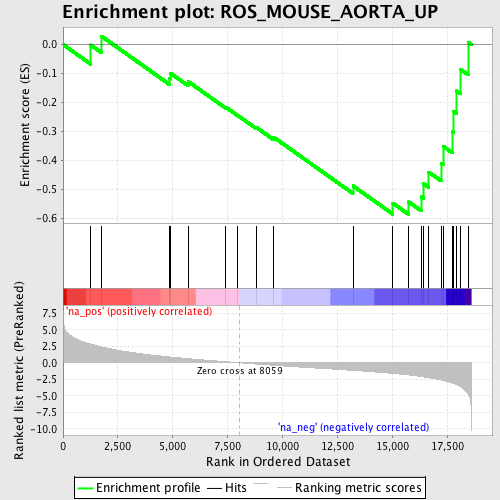
Profile of the Running ES Score & Positions of GeneSet Members on the Rank Ordered List
| Dataset | set03_absentNotch_versus_truncNotch |
| Phenotype | NoPhenotypeAvailable |
| Upregulated in class | na_neg |
| GeneSet | ROS_MOUSE_AORTA_UP |
| Enrichment Score (ES) | -0.5861588 |
| Normalized Enrichment Score (NES) | -1.8203405 |
| Nominal p-value | 0.0 |
| FDR q-value | 0.08425992 |
| FWER p-Value | 0.795 |
| PROBE | GENE SYMBOL | GENE_TITLE | RANK IN GENE LIST | RANK METRIC SCORE | RUNNING ES | CORE ENRICHMENT | |
|---|---|---|---|---|---|---|---|
| 1 | HSPD1 | 1261 | 2.819 | -0.0015 | No | ||
| 2 | SLC25A5 | 1745 | 2.405 | 0.0291 | No | ||
| 3 | CIB2 | 4839 | 0.886 | -0.1164 | No | ||
| 4 | CES1 | 4888 | 0.871 | -0.0985 | No | ||
| 5 | COX17 | 5696 | 0.619 | -0.1273 | No | ||
| 6 | ATP5G3 | 7419 | 0.161 | -0.2161 | No | ||
| 7 | PPARA | 7960 | 0.023 | -0.2446 | No | ||
| 8 | FABP3 | 8794 | -0.185 | -0.2850 | No | ||
| 9 | THEM2 | 9596 | -0.365 | -0.3195 | No | ||
| 10 | CYP4B1 | 13213 | -1.138 | -0.4872 | No | ||
| 11 | AQP7 | 15030 | -1.601 | -0.5472 | Yes | ||
| 12 | AKT2 | 15755 | -1.837 | -0.5429 | Yes | ||
| 13 | PNPLA2 | 16320 | -2.077 | -0.5244 | Yes | ||
| 14 | DGAT1 | 16420 | -2.124 | -0.4798 | Yes | ||
| 15 | MRPL4 | 16666 | -2.245 | -0.4401 | Yes | ||
| 16 | NDUFS3 | 17229 | -2.608 | -0.4090 | Yes | ||
| 17 | SDHB | 17318 | -2.680 | -0.3507 | Yes | ||
| 18 | TYSND1 | 17746 | -3.074 | -0.3013 | Yes | ||
| 19 | UBE2M | 17791 | -3.114 | -0.2304 | Yes | ||
| 20 | VEGFB | 17923 | -3.290 | -0.1600 | Yes | ||
| 21 | NDUFB10 | 18105 | -3.599 | -0.0851 | Yes | ||
| 22 | PEX6 | 18470 | -4.783 | 0.0079 | Yes |
