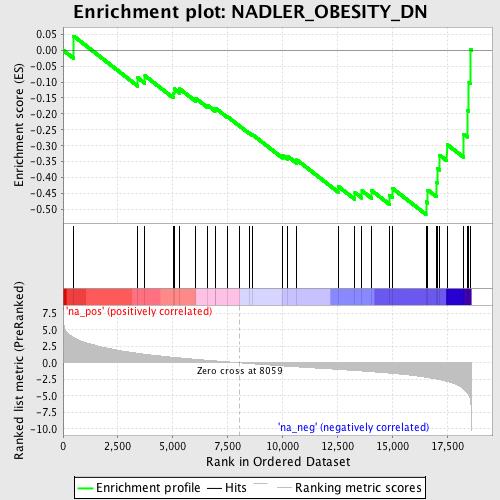
Profile of the Running ES Score & Positions of GeneSet Members on the Rank Ordered List
| Dataset | set03_absentNotch_versus_truncNotch |
| Phenotype | NoPhenotypeAvailable |
| Upregulated in class | na_neg |
| GeneSet | NADLER_OBESITY_DN |
| Enrichment Score (ES) | -0.5156555 |
| Normalized Enrichment Score (NES) | -1.8266593 |
| Nominal p-value | 0.0036363637 |
| FDR q-value | 0.09150849 |
| FWER p-Value | 0.767 |
| PROBE | GENE SYMBOL | GENE_TITLE | RANK IN GENE LIST | RANK METRIC SCORE | RUNNING ES | CORE ENRICHMENT | |
|---|---|---|---|---|---|---|---|
| 1 | GPD2 | 484 | 3.809 | 0.0441 | No | ||
| 2 | EEF1A1 | 3402 | 1.436 | -0.0864 | No | ||
| 3 | NNAT | 3729 | 1.283 | -0.0803 | No | ||
| 4 | RASD1 | 5020 | 0.828 | -0.1345 | No | ||
| 5 | APOE | 5055 | 0.817 | -0.1212 | No | ||
| 6 | DBI | 5314 | 0.741 | -0.1215 | No | ||
| 7 | ALDH2 | 6038 | 0.526 | -0.1507 | No | ||
| 8 | FDFT1 | 6573 | 0.381 | -0.1724 | No | ||
| 9 | SREBF1 | 6924 | 0.285 | -0.1860 | No | ||
| 10 | BCAT2 | 6944 | 0.280 | -0.1818 | No | ||
| 11 | UBB | 7493 | 0.142 | -0.2087 | No | ||
| 12 | THRSP | 8045 | 0.003 | -0.2383 | No | ||
| 13 | GSTA3 | 8484 | -0.111 | -0.2598 | No | ||
| 14 | RBP4 | 8642 | -0.147 | -0.2656 | No | ||
| 15 | FABP4 | 10001 | -0.464 | -0.3301 | No | ||
| 16 | GBE1 | 10242 | -0.517 | -0.3335 | No | ||
| 17 | CFD | 10655 | -0.610 | -0.3444 | No | ||
| 18 | SOD1 | 12534 | -0.997 | -0.4271 | No | ||
| 19 | ASNS | 13299 | -1.159 | -0.4468 | No | ||
| 20 | TSHR | 13621 | -1.236 | -0.4413 | No | ||
| 21 | HP | 14057 | -1.341 | -0.4400 | No | ||
| 22 | ADRB3 | 14863 | -1.551 | -0.4548 | No | ||
| 23 | PCK1 | 15000 | -1.591 | -0.4328 | No | ||
| 24 | FMO1 | 16541 | -2.181 | -0.4755 | Yes | ||
| 25 | AGT | 16624 | -2.225 | -0.4389 | Yes | ||
| 26 | UCK1 | 17015 | -2.458 | -0.4146 | Yes | ||
| 27 | CDKN2C | 17060 | -2.484 | -0.3712 | Yes | ||
| 28 | COX8A | 17167 | -2.559 | -0.3298 | Yes | ||
| 29 | DDT | 17496 | -2.815 | -0.2955 | Yes | ||
| 30 | PYGB | 18261 | -3.949 | -0.2639 | Yes | ||
| 31 | C2 | 18427 | -4.585 | -0.1883 | Yes | ||
| 32 | B2M | 18496 | -4.920 | -0.1013 | Yes | ||
| 33 | ALDOA | 18577 | -5.848 | 0.0021 | Yes |
