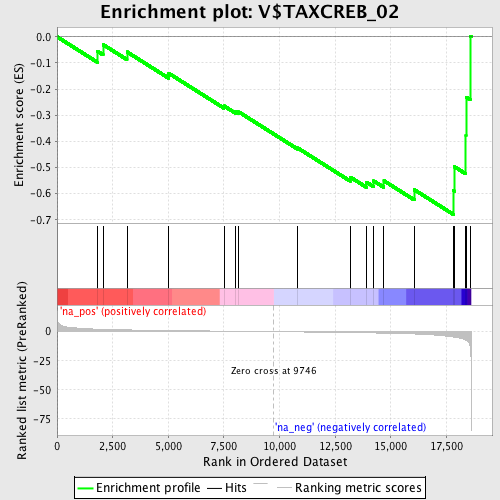
Profile of the Running ES Score & Positions of GeneSet Members on the Rank Ordered List
| Dataset | set03_absentNotch_versus_normalThy |
| Phenotype | NoPhenotypeAvailable |
| Upregulated in class | na_neg |
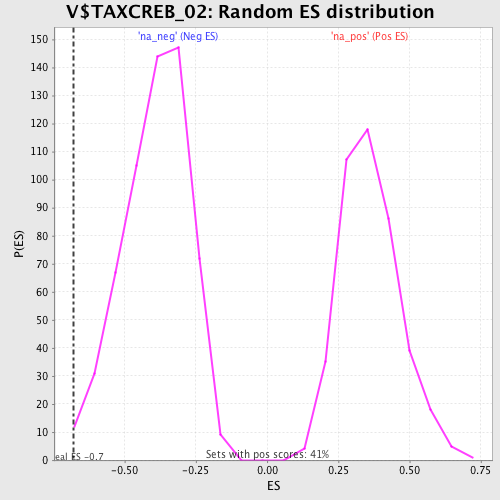
| GeneSet | V$TAXCREB_02 |
| Enrichment Score (ES) | -0.679654 |
| Normalized Enrichment Score (NES) | -1.7300792 |
| Nominal p-value | 0.0051107327 |
| FDR q-value | 0.08420429 |
| FWER p-Value | 0.739 |
| PROBE | GENE SYMBOL | GENE_TITLE | RANK IN GENE LIST | RANK METRIC SCORE | RUNNING ES | CORE ENRICHMENT | |
|---|---|---|---|---|---|---|---|
| 1 | DLK1 | 1805 | 2.118 | -0.0549 | No | ||
| 2 | EEF1A1 | 2066 | 1.975 | -0.0297 | No | ||
| 3 | EMP3 | 3142 | 1.496 | -0.0577 | No | ||
| 4 | OTP | 5019 | 0.954 | -0.1396 | No | ||
| 5 | STX12 | 7501 | 0.433 | -0.2644 | No | ||
| 6 | LIN28 | 8035 | 0.329 | -0.2865 | No | ||
| 7 | CRLF1 | 8163 | 0.305 | -0.2873 | No | ||
| 8 | ARIH1 | 10809 | -0.229 | -0.4249 | No | ||
| 9 | JAG1 | 13173 | -0.779 | -0.5365 | No | ||
| 10 | CAPN6 | 13894 | -0.991 | -0.5555 | No | ||
| 11 | SSBP3 | 14229 | -1.112 | -0.5513 | No | ||
| 12 | NKX2-3 | 14692 | -1.273 | -0.5509 | No | ||
| 13 | ADIPOR2 | 16054 | -1.970 | -0.5849 | No | ||
| 14 | NAB2 | 17818 | -4.575 | -0.5887 | Yes | ||
| 15 | PPP1R11 | 17863 | -4.725 | -0.4971 | Yes | ||
| 16 | SERTAD1 | 18377 | -7.375 | -0.3780 | Yes | ||
| 17 | BCL11A | 18381 | -7.407 | -0.2309 | Yes | ||
| 18 | S100A10 | 18566 | -12.247 | 0.0027 | Yes |