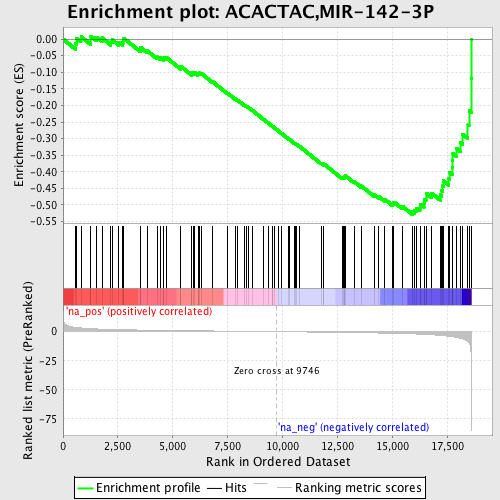
Profile of the Running ES Score & Positions of GeneSet Members on the Rank Ordered List
| Dataset | set03_absentNotch_versus_normalThy |
| Phenotype | NoPhenotypeAvailable |
| Upregulated in class | na_neg |
| GeneSet | ACACTAC,MIR-142-3P |
| Enrichment Score (ES) | -0.5286774 |
| Normalized Enrichment Score (NES) | -1.7762971 |
| Nominal p-value | 0.0013020834 |
| FDR q-value | 0.11226846 |
| FWER p-Value | 0.59 |
| PROBE | GENE SYMBOL | GENE_TITLE | RANK IN GENE LIST | RANK METRIC SCORE | RUNNING ES | CORE ENRICHMENT | |
|---|---|---|---|---|---|---|---|
| 1 | CSTF3 | 580 | 3.645 | -0.0132 | No | ||
| 2 | GTF2A1 | 621 | 3.547 | 0.0022 | No | ||
| 3 | CRK | 816 | 3.207 | 0.0077 | No | ||
| 4 | TRPS1 | 1265 | 2.576 | -0.0038 | No | ||
| 5 | HMGB1 | 1266 | 2.576 | 0.0090 | No | ||
| 6 | PSIP1 | 1536 | 2.314 | 0.0060 | No | ||
| 7 | ANK3 | 1775 | 2.140 | 0.0038 | No | ||
| 8 | ARL15 | 2181 | 1.912 | -0.0086 | No | ||
| 9 | ATP2A2 | 2231 | 1.884 | -0.0019 | No | ||
| 10 | CFL2 | 2542 | 1.735 | -0.0100 | No | ||
| 11 | COPS7A | 2711 | 1.662 | -0.0109 | No | ||
| 12 | ERG | 2730 | 1.654 | -0.0036 | No | ||
| 13 | SGK | 2769 | 1.637 | 0.0024 | No | ||
| 14 | TIRAP | 3531 | 1.356 | -0.0319 | No | ||
| 15 | APC | 3540 | 1.354 | -0.0256 | No | ||
| 16 | IRAK1 | 3833 | 1.257 | -0.0352 | No | ||
| 17 | STRN3 | 4282 | 1.135 | -0.0537 | No | ||
| 18 | RERE | 4419 | 1.096 | -0.0556 | No | ||
| 19 | CPEB2 | 4564 | 1.062 | -0.0581 | No | ||
| 20 | ROCK2 | 4595 | 1.057 | -0.0545 | No | ||
| 21 | BCLAF1 | 4704 | 1.027 | -0.0552 | No | ||
| 22 | MORF4L1 | 5356 | 0.871 | -0.0860 | No | ||
| 23 | SOX11 | 5371 | 0.868 | -0.0825 | No | ||
| 24 | MORF4L2 | 5856 | 0.768 | -0.1048 | No | ||
| 25 | XPO1 | 5864 | 0.766 | -0.1014 | No | ||
| 26 | RAC1 | 5946 | 0.749 | -0.1020 | No | ||
| 27 | SLCO4C1 | 5984 | 0.740 | -0.1004 | No | ||
| 28 | ACSL4 | 6147 | 0.708 | -0.1056 | No | ||
| 29 | AKT1S1 | 6171 | 0.703 | -0.1034 | No | ||
| 30 | UTY | 6209 | 0.697 | -0.1019 | No | ||
| 31 | EDG3 | 6319 | 0.672 | -0.1044 | No | ||
| 32 | TIPARP | 6808 | 0.568 | -0.1280 | No | ||
| 33 | STX12 | 7501 | 0.433 | -0.1632 | No | ||
| 34 | EML4 | 7840 | 0.368 | -0.1796 | No | ||
| 35 | UTX | 7962 | 0.343 | -0.1844 | No | ||
| 36 | BTBD7 | 8277 | 0.287 | -0.2000 | No | ||
| 37 | MMD | 8338 | 0.275 | -0.2018 | No | ||
| 38 | VAMP3 | 8427 | 0.259 | -0.2053 | No | ||
| 39 | SP8 | 8618 | 0.217 | -0.2145 | No | ||
| 40 | TARDBP | 9136 | 0.129 | -0.2418 | No | ||
| 41 | ACVR2A | 9382 | 0.081 | -0.2546 | No | ||
| 42 | FMNL2 | 9527 | 0.050 | -0.2621 | No | ||
| 43 | PURB | 9550 | 0.045 | -0.2631 | No | ||
| 44 | ITGAV | 9627 | 0.025 | -0.2671 | No | ||
| 45 | MGAT4A | 9820 | -0.017 | -0.2773 | No | ||
| 46 | RARG | 9975 | -0.054 | -0.2854 | No | ||
| 47 | ARID5B | 10261 | -0.115 | -0.3002 | No | ||
| 48 | SPRED1 | 10327 | -0.132 | -0.3031 | No | ||
| 49 | COPG | 10561 | -0.179 | -0.3147 | No | ||
| 50 | CLTA | 10603 | -0.187 | -0.3160 | No | ||
| 51 | SLC7A11 | 10644 | -0.195 | -0.3172 | No | ||
| 52 | MAP3K7IP2 | 10766 | -0.219 | -0.3227 | No | ||
| 53 | EHF | 11755 | -0.429 | -0.3739 | No | ||
| 54 | MLLT7 | 11877 | -0.458 | -0.3781 | No | ||
| 55 | PRLR | 11886 | -0.461 | -0.3763 | No | ||
| 56 | ADCY9 | 12714 | -0.658 | -0.4177 | No | ||
| 57 | CCNT2 | 12772 | -0.670 | -0.4174 | No | ||
| 58 | GNB2 | 12806 | -0.679 | -0.4158 | No | ||
| 59 | BACH1 | 12839 | -0.687 | -0.4141 | No | ||
| 60 | AFF2 | 12858 | -0.693 | -0.4117 | No | ||
| 61 | GNAQ | 13258 | -0.800 | -0.4292 | No | ||
| 62 | TGFBR1 | 13591 | -0.902 | -0.4427 | No | ||
| 63 | HMGA2 | 14192 | -1.097 | -0.4696 | No | ||
| 64 | MARCKS | 14370 | -1.156 | -0.4735 | No | ||
| 65 | PUM1 | 14668 | -1.260 | -0.4832 | No | ||
| 66 | MYST2 | 15004 | -1.401 | -0.4944 | No | ||
| 67 | SYPL1 | 15075 | -1.431 | -0.4911 | No | ||
| 68 | FNDC3A | 15455 | -1.624 | -0.5035 | No | ||
| 69 | PDE4B | 15923 | -1.895 | -0.5193 | Yes | ||
| 70 | PREI3 | 16028 | -1.958 | -0.5152 | Yes | ||
| 71 | INPP5A | 16104 | -2.004 | -0.5093 | Yes | ||
| 72 | RAB40C | 16267 | -2.154 | -0.5073 | Yes | ||
| 73 | STAM | 16301 | -2.185 | -0.4983 | Yes | ||
| 74 | GFI1 | 16450 | -2.314 | -0.4948 | Yes | ||
| 75 | PTPN23 | 16473 | -2.335 | -0.4844 | Yes | ||
| 76 | ATF7IP | 16541 | -2.408 | -0.4761 | Yes | ||
| 77 | RNF31 | 16542 | -2.408 | -0.4641 | Yes | ||
| 78 | CRTAM | 16800 | -2.678 | -0.4647 | Yes | ||
| 79 | MAP3K11 | 17183 | -3.201 | -0.4694 | Yes | ||
| 80 | ATG16L1 | 17260 | -3.323 | -0.4570 | Yes | ||
| 81 | PCAF | 17305 | -3.404 | -0.4425 | Yes | ||
| 82 | STAU1 | 17320 | -3.427 | -0.4263 | Yes | ||
| 83 | FKBP1A | 17581 | -3.974 | -0.4206 | Yes | ||
| 84 | LRRC1 | 17627 | -4.062 | -0.4029 | Yes | ||
| 85 | SNF1LK | 17729 | -4.328 | -0.3868 | Yes | ||
| 86 | PPFIA1 | 17748 | -4.375 | -0.3661 | Yes | ||
| 87 | FBXO3 | 17766 | -4.438 | -0.3450 | Yes | ||
| 88 | ASB7 | 17913 | -4.866 | -0.3287 | Yes | ||
| 89 | RGL2 | 18106 | -5.554 | -0.3115 | Yes | ||
| 90 | SNF1LK2 | 18208 | -6.071 | -0.2869 | Yes | ||
| 91 | ARNTL | 18452 | -8.287 | -0.2589 | Yes | ||
| 92 | DIRC2 | 18502 | -9.172 | -0.2160 | Yes | ||
| 93 | BACH2 | 18601 | -20.879 | -0.1177 | Yes | ||
| 94 | EGR2 | 18610 | -23.873 | 0.0003 | Yes |
