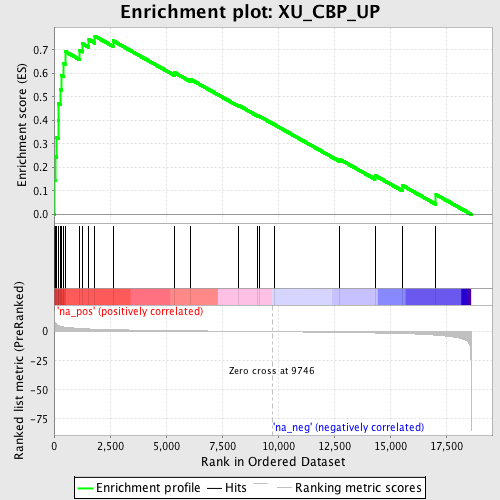
Profile of the Running ES Score & Positions of GeneSet Members on the Rank Ordered List
| Dataset | set03_absentNotch_versus_normalThy |
| Phenotype | NoPhenotypeAvailable |
| Upregulated in class | na_pos |
| GeneSet | XU_CBP_UP |
| Enrichment Score (ES) | 0.75827676 |
| Normalized Enrichment Score (NES) | 2.2993162 |
| Nominal p-value | 0.0 |
| FDR q-value | 0.0 |
| FWER p-Value | 0.0 |
| PROBE | GENE SYMBOL | GENE_TITLE | RANK IN GENE LIST | RANK METRIC SCORE | RUNNING ES | CORE ENRICHMENT | |
|---|---|---|---|---|---|---|---|
| 1 | PRMT1 | 12 | 10.328 | 0.1438 | Yes | ||
| 2 | HMOX1 | 47 | 7.454 | 0.2462 | Yes | ||
| 3 | PPAN | 114 | 6.041 | 0.3272 | Yes | ||
| 4 | GNL3 | 183 | 5.318 | 0.3979 | Yes | ||
| 5 | TSTA3 | 195 | 5.235 | 0.4705 | Yes | ||
| 6 | 2600005C20RIK | 290 | 4.626 | 0.5302 | Yes | ||
| 7 | ADSL | 317 | 4.460 | 0.5912 | Yes | ||
| 8 | LGMN | 415 | 4.096 | 0.6432 | Yes | ||
| 9 | XPOT | 492 | 3.861 | 0.6932 | Yes | ||
| 10 | NVL | 1135 | 2.753 | 0.6971 | Yes | ||
| 11 | ALG3 | 1256 | 2.593 | 0.7269 | Yes | ||
| 12 | KTN1 | 1553 | 2.299 | 0.7432 | Yes | ||
| 13 | NME4 | 1822 | 2.110 | 0.7583 | Yes | ||
| 14 | S100A6 | 2632 | 1.696 | 0.7385 | No | ||
| 15 | RAD1 | 5378 | 0.866 | 0.6030 | No | ||
| 16 | MCM2 | 6089 | 0.721 | 0.5749 | No | ||
| 17 | LRG1 | 8226 | 0.296 | 0.4641 | No | ||
| 18 | CTLA2B | 9084 | 0.137 | 0.4199 | No | ||
| 19 | RCN1 | 9166 | 0.122 | 0.4173 | No | ||
| 20 | PROM1 | 9829 | -0.018 | 0.3819 | No | ||
| 21 | MELA | 12761 | -0.668 | 0.2336 | No | ||
| 22 | LRRN1 | 14325 | -1.144 | 0.1656 | No | ||
| 23 | 9830147J24RIK | 15541 | -1.661 | 0.1235 | No | ||
| 24 | 8430420C20RIK | 17045 | -2.993 | 0.0845 | No |
