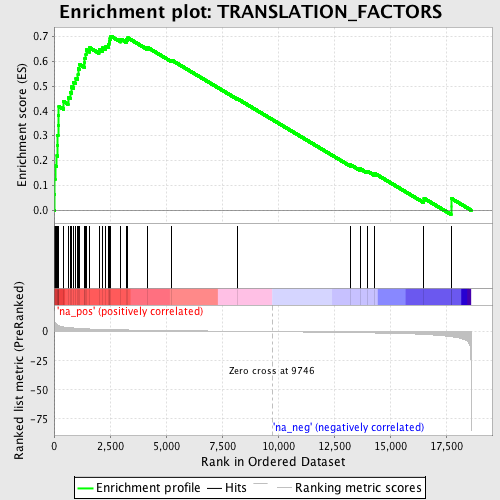
Profile of the Running ES Score & Positions of GeneSet Members on the Rank Ordered List
| Dataset | set03_absentNotch_versus_normalThy |
| Phenotype | NoPhenotypeAvailable |
| Upregulated in class | na_pos |
| GeneSet | TRANSLATION_FACTORS |
| Enrichment Score (ES) | 0.70101476 |
| Normalized Enrichment Score (NES) | 2.4054477 |
| Nominal p-value | 0.0 |
| FDR q-value | 0.0 |
| FWER p-Value | 0.0 |

| PROBE | GENE SYMBOL | GENE_TITLE | RANK IN GENE LIST | RANK METRIC SCORE | RUNNING ES | CORE ENRICHMENT | |
|---|---|---|---|---|---|---|---|
| 1 | EIF5A | 26 | 8.461 | 0.0626 | Yes | ||
| 2 | EIF2B5 | 38 | 7.912 | 0.1219 | Yes | ||
| 3 | EIF3S2 | 43 | 7.591 | 0.1792 | Yes | ||
| 4 | EIF4EBP1 | 126 | 5.803 | 0.2187 | Yes | ||
| 5 | EIF2B3 | 151 | 5.612 | 0.2599 | Yes | ||
| 6 | EIF3S6 | 160 | 5.549 | 0.3014 | Yes | ||
| 7 | EEF1D | 177 | 5.373 | 0.3413 | Yes | ||
| 8 | EIF3S9 | 187 | 5.303 | 0.3809 | Yes | ||
| 9 | EIF3S4 | 215 | 5.070 | 0.4178 | Yes | ||
| 10 | PABPC1 | 419 | 4.086 | 0.4378 | Yes | ||
| 11 | EIF2S2 | 623 | 3.545 | 0.4537 | Yes | ||
| 12 | EIF3S3 | 720 | 3.379 | 0.4742 | Yes | ||
| 13 | EIF4A1 | 769 | 3.290 | 0.4965 | Yes | ||
| 14 | EIF4E | 869 | 3.123 | 0.5148 | Yes | ||
| 15 | EIF3S7 | 973 | 2.956 | 0.5316 | Yes | ||
| 16 | ETF1 | 1065 | 2.849 | 0.5483 | Yes | ||
| 17 | EEF1G | 1072 | 2.838 | 0.5694 | Yes | ||
| 18 | EIF3S8 | 1120 | 2.772 | 0.5879 | Yes | ||
| 19 | EIF3S10 | 1365 | 2.478 | 0.5935 | Yes | ||
| 20 | EEF2 | 1372 | 2.472 | 0.6119 | Yes | ||
| 21 | EIF2B1 | 1420 | 2.431 | 0.6278 | Yes | ||
| 22 | EIF2B2 | 1429 | 2.424 | 0.6457 | Yes | ||
| 23 | ITGB4BP | 1594 | 2.272 | 0.6541 | Yes | ||
| 24 | EIF4A2 | 2004 | 2.006 | 0.6472 | Yes | ||
| 25 | EIF2S1 | 2158 | 1.922 | 0.6535 | Yes | ||
| 26 | EIF1AY | 2310 | 1.843 | 0.6593 | Yes | ||
| 27 | EEF1B2 | 2420 | 1.789 | 0.6670 | Yes | ||
| 28 | EIF2AK2 | 2452 | 1.774 | 0.6788 | Yes | ||
| 29 | EIF4G3 | 2492 | 1.758 | 0.6900 | Yes | ||
| 30 | EEF2K | 2533 | 1.741 | 0.7010 | Yes | ||
| 31 | EEF1A2 | 2974 | 1.554 | 0.6891 | No | ||
| 32 | PAIP1 | 3227 | 1.466 | 0.6866 | No | ||
| 33 | EIF4G1 | 3294 | 1.441 | 0.6940 | No | ||
| 34 | GSPT2 | 4159 | 1.164 | 0.6563 | No | ||
| 35 | EIF5 | 5246 | 0.898 | 0.6046 | No | ||
| 36 | EIF2AK1 | 8189 | 0.302 | 0.4485 | No | ||
| 37 | SLC35A4 | 13234 | -0.792 | 0.1829 | No | ||
| 38 | EIF3S1 | 13663 | -0.919 | 0.1668 | No | ||
| 39 | EIF2B4 | 13978 | -1.022 | 0.1577 | No | ||
| 40 | EIF5B | 14318 | -1.141 | 0.1480 | No | ||
| 41 | EIF3S5 | 16510 | -2.369 | 0.0480 | No | ||
| 42 | EIF2AK3 | 17721 | -4.310 | 0.0155 | No | ||
| 43 | EIF4EBP2 | 17722 | -4.311 | 0.0481 | No |
