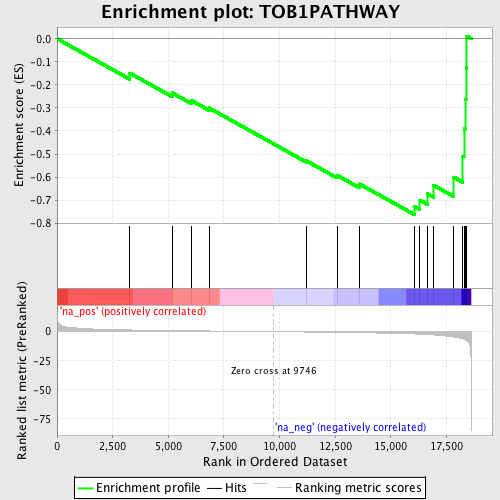
Profile of the Running ES Score & Positions of GeneSet Members on the Rank Ordered List
| Dataset | set03_absentNotch_versus_normalThy |
| Phenotype | NoPhenotypeAvailable |
| Upregulated in class | na_neg |
| GeneSet | TOB1PATHWAY |
| Enrichment Score (ES) | -0.7623115 |
| Normalized Enrichment Score (NES) | -1.9071773 |
| Nominal p-value | 0.0016750419 |
| FDR q-value | 0.1286936 |
| FWER p-Value | 0.817 |
| PROBE | GENE SYMBOL | GENE_TITLE | RANK IN GENE LIST | RANK METRIC SCORE | RUNNING ES | CORE ENRICHMENT | |
|---|---|---|---|---|---|---|---|
| 1 | TGFB3 | 3263 | 1.452 | -0.1490 | No | ||
| 2 | TGFB1 | 5169 | 0.921 | -0.2346 | No | ||
| 3 | IL4 | 6034 | 0.730 | -0.2678 | No | ||
| 4 | IL2 | 6830 | 0.565 | -0.3002 | No | ||
| 5 | TGFB2 | 11211 | -0.313 | -0.5300 | No | ||
| 6 | IFNG | 12581 | -0.623 | -0.5922 | No | ||
| 7 | TGFBR1 | 13591 | -0.902 | -0.6301 | No | ||
| 8 | TOB1 | 16052 | -1.970 | -0.7264 | Yes | ||
| 9 | IL2RA | 16308 | -2.190 | -0.7002 | Yes | ||
| 10 | TRB@ | 16652 | -2.512 | -0.6729 | Yes | ||
| 11 | CD3D | 16927 | -2.841 | -0.6358 | Yes | ||
| 12 | CD3G | 17824 | -4.591 | -0.6003 | Yes | ||
| 13 | TOB2 | 18239 | -6.235 | -0.5089 | Yes | ||
| 14 | CD28 | 18291 | -6.622 | -0.3910 | Yes | ||
| 15 | TGFBR3 | 18371 | -7.331 | -0.2616 | Yes | ||
| 16 | TGFBR2 | 18385 | -7.438 | -0.1268 | Yes | ||
| 17 | CD3E | 18405 | -7.633 | 0.0113 | Yes |
