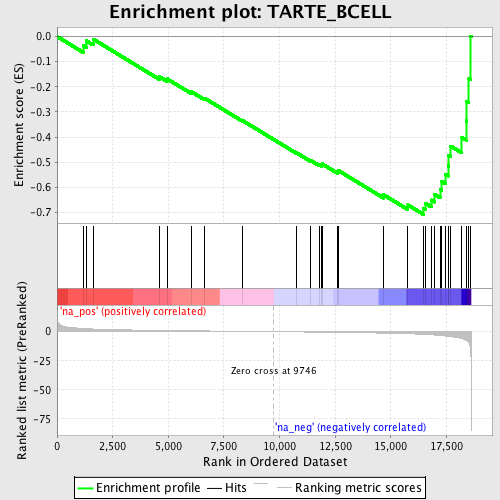
Profile of the Running ES Score & Positions of GeneSet Members on the Rank Ordered List
| Dataset | set03_absentNotch_versus_normalThy |
| Phenotype | NoPhenotypeAvailable |
| Upregulated in class | na_neg |
| GeneSet | TARTE_BCELL |
| Enrichment Score (ES) | -0.70749474 |
| Normalized Enrichment Score (NES) | -2.0074825 |
| Nominal p-value | 0.0 |
| FDR q-value | 0.2924875 |
| FWER p-Value | 0.471 |
| PROBE | GENE SYMBOL | GENE_TITLE | RANK IN GENE LIST | RANK METRIC SCORE | RUNNING ES | CORE ENRICHMENT | |
|---|---|---|---|---|---|---|---|
| 1 | NFKBIE | 1172 | 2.703 | -0.0354 | No | ||
| 2 | MAPRE2 | 1310 | 2.536 | -0.0168 | No | ||
| 3 | GCH1 | 1625 | 2.251 | -0.0106 | No | ||
| 4 | CIITA | 4589 | 1.058 | -0.1592 | No | ||
| 5 | LYL1 | 4941 | 0.970 | -0.1682 | No | ||
| 6 | RHOH | 6018 | 0.732 | -0.2185 | No | ||
| 7 | NFKB1 | 6645 | 0.606 | -0.2460 | No | ||
| 8 | MMD | 8338 | 0.275 | -0.3343 | No | ||
| 9 | BLK | 10746 | -0.215 | -0.4616 | No | ||
| 10 | MS4A1 | 11396 | -0.350 | -0.4929 | No | ||
| 11 | REL | 11773 | -0.433 | -0.5087 | No | ||
| 12 | MOBK1B | 11896 | -0.463 | -0.5105 | No | ||
| 13 | AHR | 11912 | -0.466 | -0.5066 | No | ||
| 14 | AIM1 | 12590 | -0.624 | -0.5366 | No | ||
| 15 | IRF8 | 12634 | -0.636 | -0.5324 | No | ||
| 16 | ITPR1 | 14675 | -1.265 | -0.6292 | No | ||
| 17 | HHEX | 15769 | -1.797 | -0.6696 | No | ||
| 18 | BLR1 | 16474 | -2.336 | -0.6836 | Yes | ||
| 19 | ELF4 | 16551 | -2.416 | -0.6629 | Yes | ||
| 20 | CCND3 | 16825 | -2.709 | -0.6499 | Yes | ||
| 21 | BIN1 | 16977 | -2.895 | -0.6283 | Yes | ||
| 22 | CD83 | 17215 | -3.254 | -0.6078 | Yes | ||
| 23 | SATB1 | 17293 | -3.384 | -0.5772 | Yes | ||
| 24 | IFNGR1 | 17448 | -3.681 | -0.5478 | Yes | ||
| 25 | CD37 | 17574 | -3.961 | -0.5140 | Yes | ||
| 26 | RHOG | 17604 | -4.011 | -0.4745 | Yes | ||
| 27 | GPR18 | 17683 | -4.224 | -0.4354 | Yes | ||
| 28 | AXIN1 | 18194 | -5.994 | -0.4014 | Yes | ||
| 29 | TGFBR2 | 18385 | -7.438 | -0.3355 | Yes | ||
| 30 | GIT2 | 18409 | -7.660 | -0.2583 | Yes | ||
| 31 | LTB | 18510 | -9.387 | -0.1675 | Yes | ||
| 32 | IL4R | 18586 | -16.906 | 0.0016 | Yes |
