Profile of the Running ES Score & Positions of GeneSet Members on the Rank Ordered List
| Dataset | set03_absentNotch_versus_normalThy |
| Phenotype | NoPhenotypeAvailable |
| Upregulated in class | na_neg |
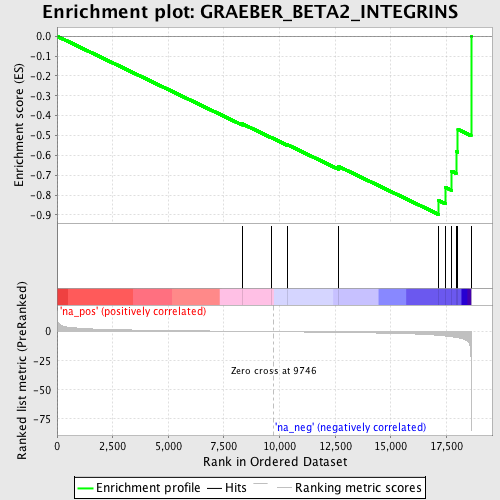
| GeneSet | GRAEBER_BETA2_INTEGRINS |
| Enrichment Score (ES) | -0.8976382 |
| Normalized Enrichment Score (NES) | -1.9782661 |
| Nominal p-value | 0.0 |
| FDR q-value | 0.20284474 |
| FWER p-Value | 0.593 |
| PROBE | GENE SYMBOL | GENE_TITLE | RANK IN GENE LIST | RANK METRIC SCORE | RUNNING ES | CORE ENRICHMENT | |
|---|---|---|---|---|---|---|---|
| 1 | ITGA3 | 8321 | 0.280 | -0.4410 | No | ||
| 2 | ITGAV | 9627 | 0.025 | -0.5106 | No | ||
| 3 | ITGAX | 10335 | -0.133 | -0.5456 | No | ||
| 4 | ITGB7 | 12652 | -0.640 | -0.6558 | No | ||
| 5 | ITGA5 | 17153 | -3.155 | -0.8273 | Yes | ||
| 6 | ITGB2 | 17454 | -3.701 | -0.7610 | Yes | ||
| 7 | ITGAE | 17733 | -4.335 | -0.6793 | Yes | ||
| 8 | ITGAL | 17935 | -4.914 | -0.5806 | Yes | ||
| 9 | ITGB4 | 18017 | -5.184 | -0.4695 | Yes | ||
| 10 | ITGA6 | 18607 | -22.511 | 0.0005 | Yes |
