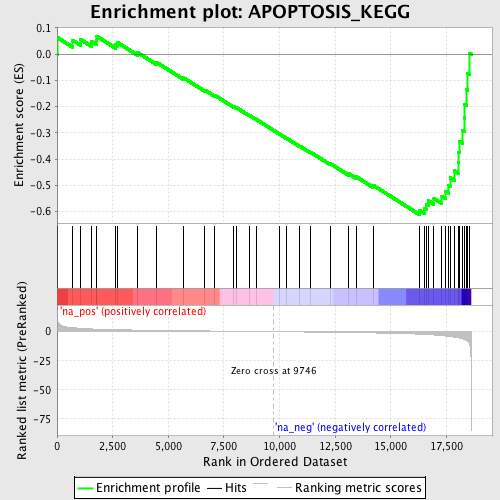
Profile of the Running ES Score & Positions of GeneSet Members on the Rank Ordered List
| Dataset | set03_absentNotch_versus_normalThy |
| Phenotype | NoPhenotypeAvailable |
| Upregulated in class | na_neg |
| GeneSet | APOPTOSIS_KEGG |
| Enrichment Score (ES) | -0.611545 |
| Normalized Enrichment Score (NES) | -1.8769605 |
| Nominal p-value | 0.0 |
| FDR q-value | 0.12296125 |
| FWER p-Value | 0.891 |
| PROBE | GENE SYMBOL | GENE_TITLE | RANK IN GENE LIST | RANK METRIC SCORE | RUNNING ES | CORE ENRICHMENT | |
|---|---|---|---|---|---|---|---|
| 1 | BAX | 28 | 8.257 | 0.0627 | No | ||
| 2 | BOK | 702 | 3.410 | 0.0529 | No | ||
| 3 | SFRS2IP | 1051 | 2.871 | 0.0565 | No | ||
| 4 | TRAF6 | 1541 | 2.310 | 0.0481 | No | ||
| 5 | NR3C1 | 1754 | 2.156 | 0.0534 | No | ||
| 6 | CYCS | 1777 | 2.140 | 0.0689 | No | ||
| 7 | RIPK1 | 2636 | 1.696 | 0.0359 | No | ||
| 8 | TNFRSF1B | 2726 | 1.655 | 0.0439 | No | ||
| 9 | CASP4 | 3621 | 1.320 | 0.0061 | No | ||
| 10 | CASP1 | 4451 | 1.088 | -0.0301 | No | ||
| 11 | CASP3 | 5671 | 0.806 | -0.0895 | No | ||
| 12 | NFKB1 | 6645 | 0.606 | -0.1372 | No | ||
| 13 | BAD | 7079 | 0.515 | -0.1565 | No | ||
| 14 | NTRK1 | 7931 | 0.348 | -0.1996 | No | ||
| 15 | TNF | 8047 | 0.328 | -0.2032 | No | ||
| 16 | PTPN13 | 8640 | 0.215 | -0.2334 | No | ||
| 17 | DFFB | 8967 | 0.160 | -0.2498 | No | ||
| 18 | NGFB | 10002 | -0.059 | -0.3050 | No | ||
| 19 | CRADD | 10301 | -0.125 | -0.3200 | No | ||
| 20 | CASP8 | 10915 | -0.252 | -0.3511 | No | ||
| 21 | CD40LG | 11379 | -0.346 | -0.3733 | No | ||
| 22 | NGFR | 12270 | -0.550 | -0.4170 | No | ||
| 23 | FADD | 13106 | -0.762 | -0.4560 | No | ||
| 24 | APAF1 | 13440 | -0.850 | -0.4673 | No | ||
| 25 | DFFA | 14198 | -1.099 | -0.4996 | No | ||
| 26 | CASP9 | 16279 | -2.163 | -0.5947 | Yes | ||
| 27 | CD40 | 16527 | -2.391 | -0.5895 | Yes | ||
| 28 | CASP2 | 16591 | -2.452 | -0.5738 | Yes | ||
| 29 | NFKBIA | 16685 | -2.540 | -0.5591 | Yes | ||
| 30 | BCL2L2 | 16936 | -2.850 | -0.5504 | Yes | ||
| 31 | DAXX | 17296 | -3.389 | -0.5434 | Yes | ||
| 32 | BCL2L1 | 17452 | -3.694 | -0.5230 | Yes | ||
| 33 | IKBKE | 17597 | -3.998 | -0.4997 | Yes | ||
| 34 | FASLG | 17668 | -4.176 | -0.4710 | Yes | ||
| 35 | LTA | 17854 | -4.683 | -0.4446 | Yes | ||
| 36 | TRAF2 | 18025 | -5.204 | -0.4133 | Yes | ||
| 37 | FAS | 18055 | -5.334 | -0.3734 | Yes | ||
| 38 | MCL1 | 18097 | -5.495 | -0.3329 | Yes | ||
| 39 | TNFRSF1A | 18237 | -6.230 | -0.2920 | Yes | ||
| 40 | CASP6 | 18308 | -6.764 | -0.2432 | Yes | ||
| 41 | TRAF3 | 18317 | -6.862 | -0.1903 | Yes | ||
| 42 | CASP7 | 18410 | -7.664 | -0.1357 | Yes | ||
| 43 | TRAF1 | 18458 | -8.368 | -0.0732 | Yes | ||
| 44 | BCL2 | 18536 | -10.511 | 0.0043 | Yes |
