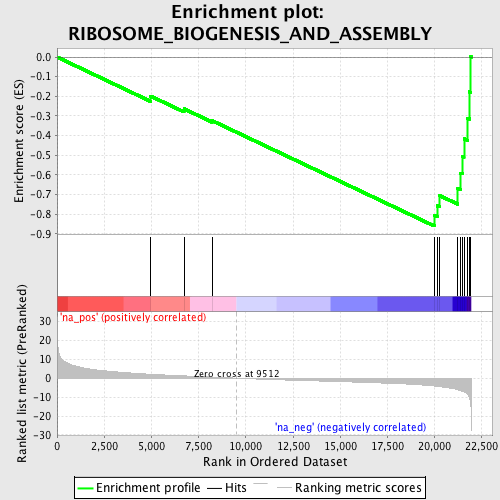
Profile of the Running ES Score & Positions of GeneSet Members on the Rank Ordered List
| Dataset | set02_BT_ATM_minus_versus_ATM_plus |
| Phenotype | NoPhenotypeAvailable |
| Upregulated in class | na_neg |
| GeneSet | RIBOSOME_BIOGENESIS_AND_ASSEMBLY |
| Enrichment Score (ES) | -0.860369 |
| Normalized Enrichment Score (NES) | -2.3531199 |
| Nominal p-value | 0.0 |
| FDR q-value | 2.0298506E-4 |
| FWER p-Value | 0.0010 |
| PROBE | GENE SYMBOL | GENE_TITLE | RANK IN GENE LIST | RANK METRIC SCORE | RUNNING ES | CORE ENRICHMENT | |
|---|---|---|---|---|---|---|---|
| 1 | GEMIN4 | 4954 | 2.067 | -0.1987 | No | ||
| 2 | RPS14 | 6727 | 1.204 | -0.2637 | No | ||
| 3 | EXOSC7 | 8208 | 0.574 | -0.3237 | No | ||
| 4 | EIF2A | 19981 | -4.109 | -0.8065 | Yes | ||
| 5 | EXOSC3 | 20141 | -4.283 | -0.7576 | Yes | ||
| 6 | FBL | 20264 | -4.415 | -0.7053 | Yes | ||
| 7 | NPM1 | 21234 | -6.089 | -0.6696 | Yes | ||
| 8 | SDAD1 | 21371 | -6.501 | -0.5906 | Yes | ||
| 9 | NOLA2 | 21479 | -6.851 | -0.5056 | Yes | ||
| 10 | POP4 | 21562 | -7.166 | -0.4154 | Yes | ||
| 11 | EXOSC2 | 21754 | -8.613 | -0.3112 | Yes | ||
| 12 | NOL5A | 21859 | -10.573 | -0.1773 | Yes | ||
| 13 | NOLC1 | 21924 | -13.825 | 0.0010 | Yes |
