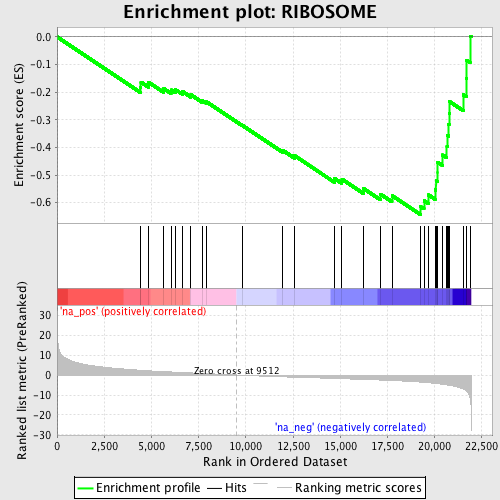
Profile of the Running ES Score & Positions of GeneSet Members on the Rank Ordered List
| Dataset | set02_BT_ATM_minus_versus_ATM_plus |
| Phenotype | NoPhenotypeAvailable |
| Upregulated in class | na_neg |
| GeneSet | RIBOSOME |
| Enrichment Score (ES) | -0.64290166 |
| Normalized Enrichment Score (NES) | -2.3036454 |
| Nominal p-value | 0.0 |
| FDR q-value | 2.4960935E-4 |
| FWER p-Value | 0.0020 |
| PROBE | GENE SYMBOL | GENE_TITLE | RANK IN GENE LIST | RANK METRIC SCORE | RUNNING ES | CORE ENRICHMENT | |
|---|---|---|---|---|---|---|---|
| 1 | RPL15 | 4412 | 2.376 | -0.1817 | No | ||
| 2 | MRPL23 | 4443 | 2.358 | -0.1636 | No | ||
| 3 | FAU | 4853 | 2.120 | -0.1648 | No | ||
| 4 | NUFIP2 | 5655 | 1.699 | -0.1873 | No | ||
| 5 | RPL13A | 6038 | 1.526 | -0.1921 | No | ||
| 6 | MRPS21 | 6272 | 1.419 | -0.1910 | No | ||
| 7 | MRPS24 | 6646 | 1.233 | -0.1979 | No | ||
| 8 | RPS11 | 7090 | 1.041 | -0.2095 | No | ||
| 9 | MRPS16 | 7683 | 0.791 | -0.2300 | No | ||
| 10 | NR0B1 | 7926 | 0.694 | -0.2353 | No | ||
| 11 | MRPL10 | 9818 | -0.141 | -0.3204 | No | ||
| 12 | SRP68 | 11955 | -0.906 | -0.4104 | No | ||
| 13 | RPL7A | 12581 | -1.090 | -0.4299 | No | ||
| 14 | MRPS12 | 14711 | -1.715 | -0.5129 | No | ||
| 15 | RPS4X | 15094 | -1.832 | -0.5153 | No | ||
| 16 | MRPL41 | 16236 | -2.198 | -0.5492 | No | ||
| 17 | MRPS11 | 17128 | -2.509 | -0.5691 | No | ||
| 18 | FMR1 | 17747 | -2.747 | -0.5746 | No | ||
| 19 | MRPS18A | 19244 | -3.505 | -0.6140 | Yes | ||
| 20 | RPS7 | 19444 | -3.643 | -0.5930 | Yes | ||
| 21 | MRPL40 | 19681 | -3.832 | -0.5721 | Yes | ||
| 22 | RRBP1 | 20032 | -4.175 | -0.5536 | Yes | ||
| 23 | MRPS18C | 20077 | -4.216 | -0.5208 | Yes | ||
| 24 | RPL3L | 20170 | -4.312 | -0.4894 | Yes | ||
| 25 | MRPS28 | 20172 | -4.313 | -0.4538 | Yes | ||
| 26 | MRPL55 | 20435 | -4.641 | -0.4274 | Yes | ||
| 27 | MRPL51 | 20658 | -4.929 | -0.3968 | Yes | ||
| 28 | MRPS35 | 20677 | -4.969 | -0.3566 | Yes | ||
| 29 | MRPL12 | 20741 | -5.100 | -0.3174 | Yes | ||
| 30 | MRPL52 | 20774 | -5.154 | -0.2763 | Yes | ||
| 31 | MRPS22 | 20792 | -5.186 | -0.2342 | Yes | ||
| 32 | APEX1 | 21526 | -7.036 | -0.2096 | Yes | ||
| 33 | MRPS36 | 21695 | -8.017 | -0.1510 | Yes | ||
| 34 | MRPS15 | 21708 | -8.145 | -0.0843 | Yes | ||
| 35 | MRPS10 | 21886 | -11.528 | 0.0028 | Yes |
