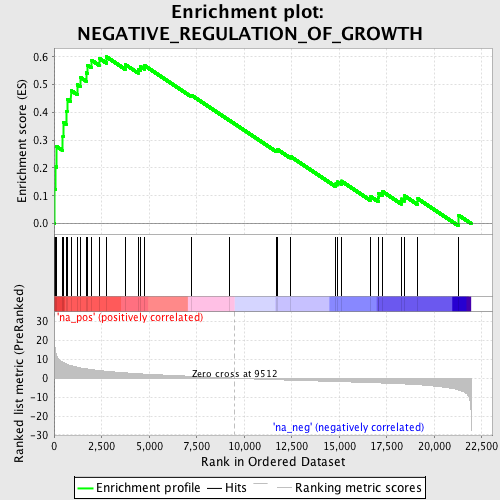
Profile of the Running ES Score & Positions of GeneSet Members on the Rank Ordered List
| Dataset | set02_BT_ATM_minus_versus_ATM_plus |
| Phenotype | NoPhenotypeAvailable |
| Upregulated in class | na_pos |
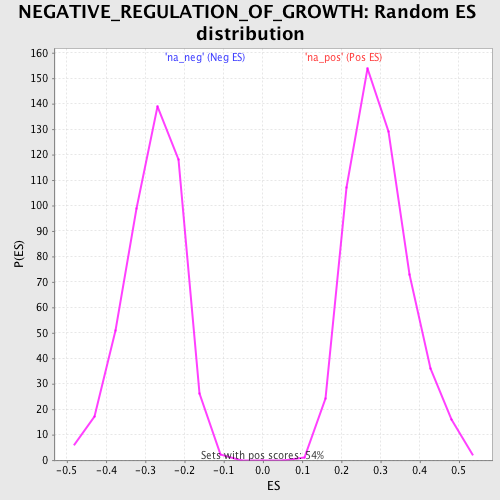
| GeneSet | NEGATIVE_REGULATION_OF_GROWTH |
| Enrichment Score (ES) | 0.5996666 |
| Normalized Enrichment Score (NES) | 2.0209124 |
| Nominal p-value | 0.0 |
| FDR q-value | 0.022597928 |
| FWER p-Value | 0.105 |
| PROBE | GENE SYMBOL | GENE_TITLE | RANK IN GENE LIST | RANK METRIC SCORE | RUNNING ES | CORE ENRICHMENT | |
|---|---|---|---|---|---|---|---|
| 1 | CDKN2D | 15 | 20.092 | 0.1237 | Yes | ||
| 2 | BCL6 | 77 | 13.547 | 0.2048 | Yes | ||
| 3 | IHPK2 | 131 | 12.123 | 0.2775 | Yes | ||
| 4 | PML | 463 | 8.372 | 0.3142 | Yes | ||
| 5 | SERTAD3 | 490 | 8.198 | 0.3638 | Yes | ||
| 6 | KLK8 | 635 | 7.550 | 0.4040 | Yes | ||
| 7 | TGFB1 | 684 | 7.346 | 0.4473 | Yes | ||
| 8 | CDKN1B | 888 | 6.624 | 0.4790 | Yes | ||
| 9 | ING4 | 1230 | 5.786 | 0.4993 | Yes | ||
| 10 | ACVR1B | 1375 | 5.443 | 0.5264 | Yes | ||
| 11 | BBC3 | 1697 | 4.900 | 0.5421 | Yes | ||
| 12 | NDUFA13 | 1742 | 4.842 | 0.5701 | Yes | ||
| 13 | RB1 | 1959 | 4.524 | 0.5882 | Yes | ||
| 14 | SERTAD2 | 2377 | 4.033 | 0.5942 | Yes | ||
| 15 | ING5 | 2754 | 3.656 | 0.5997 | Yes | ||
| 16 | INHBA | 3744 | 2.844 | 0.5721 | No | ||
| 17 | SMAD3 | 4422 | 2.369 | 0.5559 | No | ||
| 18 | PPT1 | 4558 | 2.285 | 0.5639 | No | ||
| 19 | SMAD4 | 4759 | 2.167 | 0.5682 | No | ||
| 20 | APBB1 | 7217 | 0.991 | 0.4622 | No | ||
| 21 | CDA | 9245 | 0.131 | 0.3705 | No | ||
| 22 | DLC1 | 11686 | -0.820 | 0.2642 | No | ||
| 23 | BMP10 | 11760 | -0.845 | 0.2661 | No | ||
| 24 | RERG | 12427 | -1.043 | 0.2422 | No | ||
| 25 | DCBLD2 | 14833 | -1.752 | 0.1433 | No | ||
| 26 | PTCH1 | 14934 | -1.780 | 0.1498 | No | ||
| 27 | CDKN2C | 15110 | -1.840 | 0.1532 | No | ||
| 28 | PPP1R9B | 16637 | -2.334 | 0.0980 | No | ||
| 29 | APBB2 | 17065 | -2.489 | 0.0939 | No | ||
| 30 | TSPYL2 | 17083 | -2.494 | 0.1086 | No | ||
| 31 | ENO1 | 17283 | -2.566 | 0.1154 | No | ||
| 32 | CDKN1A | 18276 | -2.964 | 0.0885 | No | ||
| 33 | NDUFS3 | 18441 | -3.046 | 0.0998 | No | ||
| 34 | CDKN2A | 19143 | -3.446 | 0.0892 | No | ||
| 35 | TP53 | 21287 | -6.255 | 0.0301 | No |