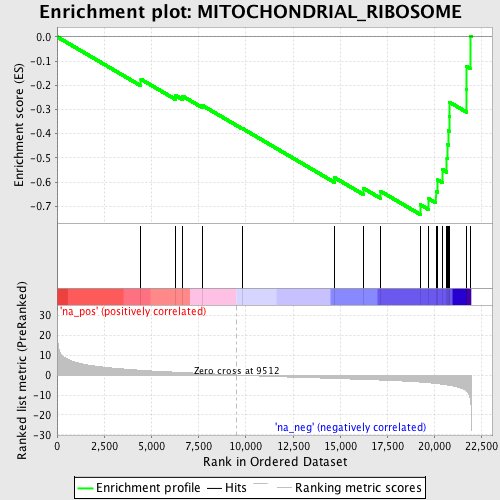
Profile of the Running ES Score & Positions of GeneSet Members on the Rank Ordered List
| Dataset | set02_BT_ATM_minus_versus_ATM_plus |
| Phenotype | NoPhenotypeAvailable |
| Upregulated in class | na_neg |
| GeneSet | MITOCHONDRIAL_RIBOSOME |
| Enrichment Score (ES) | -0.73334527 |
| Normalized Enrichment Score (NES) | -2.3336933 |
| Nominal p-value | 0.0 |
| FDR q-value | 1.6915423E-4 |
| FWER p-Value | 0.0010 |
| PROBE | GENE SYMBOL | GENE_TITLE | RANK IN GENE LIST | RANK METRIC SCORE | RUNNING ES | CORE ENRICHMENT | |
|---|---|---|---|---|---|---|---|
| 1 | MRPL23 | 4443 | 2.358 | -0.1752 | No | ||
| 2 | MRPS21 | 6272 | 1.419 | -0.2420 | No | ||
| 3 | MRPS24 | 6646 | 1.233 | -0.2447 | No | ||
| 4 | MRPS16 | 7683 | 0.791 | -0.2827 | No | ||
| 5 | MRPL10 | 9818 | -0.141 | -0.3784 | No | ||
| 6 | MRPS12 | 14711 | -1.715 | -0.5815 | No | ||
| 7 | MRPL41 | 16236 | -2.198 | -0.6255 | No | ||
| 8 | MRPS11 | 17128 | -2.509 | -0.6369 | No | ||
| 9 | MRPS18A | 19244 | -3.505 | -0.6925 | Yes | ||
| 10 | MRPL40 | 19681 | -3.832 | -0.6678 | Yes | ||
| 11 | MRPS18C | 20077 | -4.216 | -0.6367 | Yes | ||
| 12 | MRPS28 | 20172 | -4.313 | -0.5908 | Yes | ||
| 13 | MRPL55 | 20435 | -4.641 | -0.5487 | Yes | ||
| 14 | MRPL51 | 20658 | -4.929 | -0.5015 | Yes | ||
| 15 | MRPS35 | 20677 | -4.969 | -0.4445 | Yes | ||
| 16 | MRPL12 | 20741 | -5.100 | -0.3880 | Yes | ||
| 17 | MRPL52 | 20774 | -5.154 | -0.3294 | Yes | ||
| 18 | MRPS22 | 20792 | -5.186 | -0.2698 | Yes | ||
| 19 | MRPS36 | 21695 | -8.017 | -0.2176 | Yes | ||
| 20 | MRPS15 | 21708 | -8.145 | -0.1233 | Yes | ||
| 21 | MRPS10 | 21886 | -11.528 | 0.0028 | Yes |
