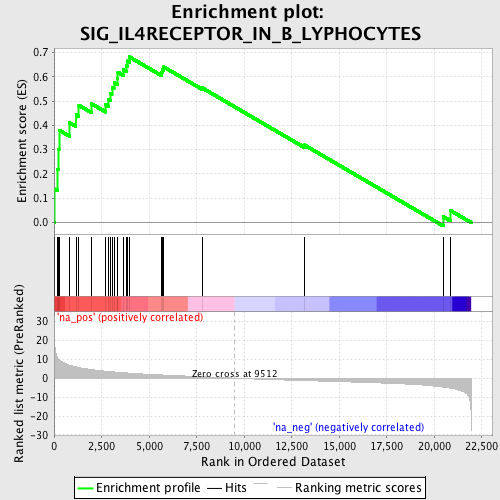
Profile of the Running ES Score & Positions of GeneSet Members on the Rank Ordered List
| Dataset | set02_BT_ATM_minus_versus_ATM_plus |
| Phenotype | NoPhenotypeAvailable |
| Upregulated in class | na_pos |
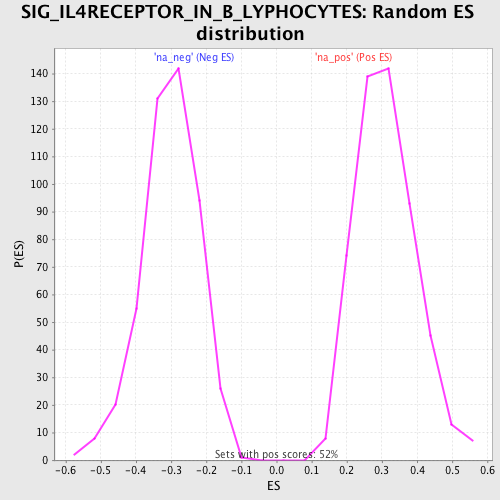
| GeneSet | SIG_IL4RECEPTOR_IN_B_LYPHOCYTES |
| Enrichment Score (ES) | 0.6820721 |
| Normalized Enrichment Score (NES) | 2.1888354 |
| Nominal p-value | 0.0 |
| FDR q-value | 0.0010079093 |
| FWER p-Value | 0.0030 |
| PROBE | GENE SYMBOL | GENE_TITLE | RANK IN GENE LIST | RANK METRIC SCORE | RUNNING ES | CORE ENRICHMENT | |
|---|---|---|---|---|---|---|---|
| 1 | SOCS1 | 32 | 17.187 | 0.1383 | Yes | ||
| 2 | PPP1R13B | 189 | 10.746 | 0.2186 | Yes | ||
| 3 | PIK3CD | 211 | 10.436 | 0.3025 | Yes | ||
| 4 | IL4R | 259 | 9.853 | 0.3805 | Yes | ||
| 5 | RAF1 | 819 | 6.824 | 0.4105 | Yes | ||
| 6 | BCL2 | 1151 | 5.973 | 0.4440 | Yes | ||
| 7 | AKT2 | 1306 | 5.599 | 0.4825 | Yes | ||
| 8 | MAPK3 | 1966 | 4.511 | 0.4892 | Yes | ||
| 9 | SHC1 | 2716 | 3.694 | 0.4851 | Yes | ||
| 10 | PIK3CA | 2870 | 3.541 | 0.5069 | Yes | ||
| 11 | GSK3B | 2980 | 3.451 | 0.5300 | Yes | ||
| 12 | JAK3 | 3047 | 3.397 | 0.5546 | Yes | ||
| 13 | STAT6 | 3153 | 3.303 | 0.5767 | Yes | ||
| 14 | IRS2 | 3324 | 3.163 | 0.5946 | Yes | ||
| 15 | SOS1 | 3360 | 3.127 | 0.6185 | Yes | ||
| 16 | BAD | 3655 | 2.905 | 0.6287 | Yes | ||
| 17 | AKT1 | 3802 | 2.803 | 0.6448 | Yes | ||
| 18 | PDK1 | 3851 | 2.765 | 0.6651 | Yes | ||
| 19 | AKT3 | 3957 | 2.670 | 0.6821 | Yes | ||
| 20 | JAK1 | 5653 | 1.700 | 0.6186 | No | ||
| 21 | GSK3A | 5701 | 1.683 | 0.6301 | No | ||
| 22 | PIK3R1 | 5770 | 1.654 | 0.6405 | No | ||
| 23 | SOS2 | 7785 | 0.747 | 0.5547 | No | ||
| 24 | IRS1 | 13166 | -1.265 | 0.3196 | No | ||
| 25 | MAPK1 | 20477 | -4.696 | 0.0243 | No | ||
| 26 | GRB2 | 20842 | -5.251 | 0.0504 | No |