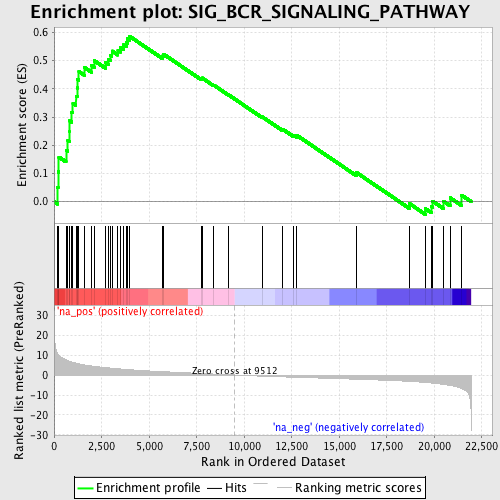
Profile of the Running ES Score & Positions of GeneSet Members on the Rank Ordered List
| Dataset | set02_BT_ATM_minus_versus_ATM_plus |
| Phenotype | NoPhenotypeAvailable |
| Upregulated in class | na_pos |
| GeneSet | SIG_BCR_SIGNALING_PATHWAY |
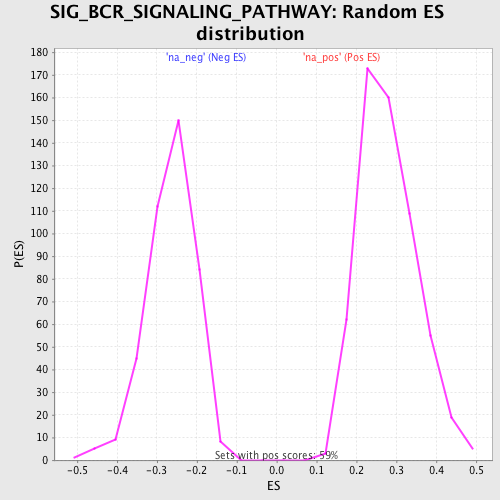
| Enrichment Score (ES) | 0.5866933 |
| Normalized Enrichment Score (NES) | 2.1030054 |
| Nominal p-value | 0.0 |
| FDR q-value | 0.0034702534 |
| FWER p-Value | 0.03 |
| PROBE | GENE SYMBOL | GENE_TITLE | RANK IN GENE LIST | RANK METRIC SCORE | RUNNING ES | CORE ENRICHMENT | |
|---|---|---|---|---|---|---|---|
| 1 | PPP1R13B | 189 | 10.746 | 0.0498 | Yes | ||
| 2 | PIK3CD | 211 | 10.436 | 0.1056 | Yes | ||
| 3 | FLOT2 | 253 | 9.962 | 0.1579 | Yes | ||
| 4 | VAV1 | 628 | 7.582 | 0.1821 | Yes | ||
| 5 | INPP5D | 724 | 7.159 | 0.2167 | Yes | ||
| 6 | RAF1 | 819 | 6.824 | 0.2495 | Yes | ||
| 7 | NFATC1 | 826 | 6.800 | 0.2862 | Yes | ||
| 8 | ITPR2 | 927 | 6.521 | 0.3171 | Yes | ||
| 9 | PPP3CB | 991 | 6.360 | 0.3488 | Yes | ||
| 10 | BCL2 | 1151 | 5.973 | 0.3741 | Yes | ||
| 11 | SYK | 1212 | 5.837 | 0.4031 | Yes | ||
| 12 | CSK | 1223 | 5.821 | 0.4343 | Yes | ||
| 13 | AKT2 | 1306 | 5.599 | 0.4610 | Yes | ||
| 14 | FLOT1 | 1597 | 5.059 | 0.4753 | Yes | ||
| 15 | MAPK3 | 1966 | 4.511 | 0.4830 | Yes | ||
| 16 | ITPR1 | 2124 | 4.312 | 0.4993 | Yes | ||
| 17 | SHC1 | 2716 | 3.694 | 0.4924 | Yes | ||
| 18 | PIK3CA | 2870 | 3.541 | 0.5047 | Yes | ||
| 19 | GSK3B | 2980 | 3.451 | 0.5185 | Yes | ||
| 20 | PTPRC | 3046 | 3.398 | 0.5340 | Yes | ||
| 21 | SOS1 | 3360 | 3.127 | 0.5367 | Yes | ||
| 22 | CD81 | 3504 | 3.020 | 0.5466 | Yes | ||
| 23 | BAD | 3655 | 2.905 | 0.5555 | Yes | ||
| 24 | AKT1 | 3802 | 2.803 | 0.5641 | Yes | ||
| 25 | PDK1 | 3851 | 2.765 | 0.5770 | Yes | ||
| 26 | AKT3 | 3957 | 2.670 | 0.5867 | Yes | ||
| 27 | GSK3A | 5701 | 1.683 | 0.5163 | No | ||
| 28 | PIK3R1 | 5770 | 1.654 | 0.5222 | No | ||
| 29 | ITPR3 | 7763 | 0.754 | 0.4353 | No | ||
| 30 | SOS2 | 7785 | 0.747 | 0.4384 | No | ||
| 31 | NR0B2 | 8404 | 0.497 | 0.4129 | No | ||
| 32 | CR2 | 9161 | 0.166 | 0.3793 | No | ||
| 33 | CD19 | 10959 | -0.570 | 0.3004 | No | ||
| 34 | BTK | 12025 | -0.929 | 0.2568 | No | ||
| 35 | CD22 | 12622 | -1.103 | 0.2356 | No | ||
| 36 | BCR | 12777 | -1.150 | 0.2348 | No | ||
| 37 | BLNK | 15915 | -2.099 | 0.1030 | No | ||
| 38 | PPP3CA | 18699 | -3.178 | -0.0068 | No | ||
| 39 | NFATC2 | 19548 | -3.725 | -0.0252 | No | ||
| 40 | PLCG2 | 19865 | -4.009 | -0.0178 | No | ||
| 41 | DAG1 | 19922 | -4.054 | 0.0017 | No | ||
| 42 | MAPK1 | 20477 | -4.696 | 0.0019 | No | ||
| 43 | GRB2 | 20842 | -5.251 | 0.0138 | No | ||
| 44 | PPP3CC | 21439 | -6.721 | 0.0232 | No |