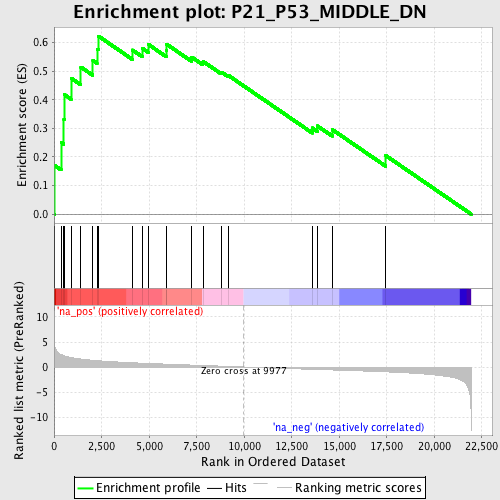
Profile of the Running ES Score & Positions of GeneSet Members on the Rank Ordered List
| Dataset | set02_ATM_minus_versus_BT_ATM_minus |
| Phenotype | NoPhenotypeAvailable |
| Upregulated in class | na_pos |
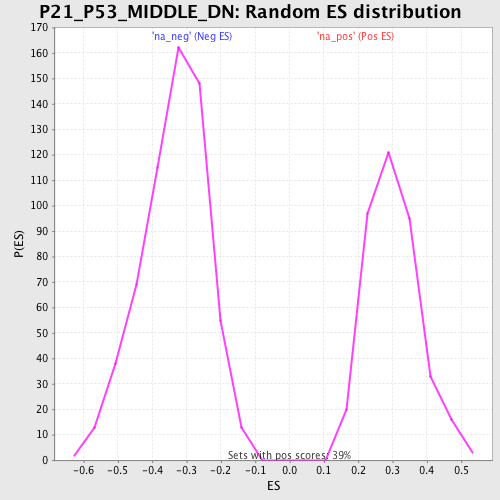
| GeneSet | P21_P53_MIDDLE_DN |
| Enrichment Score (ES) | 0.6227164 |
| Normalized Enrichment Score (NES) | 2.058861 |
| Nominal p-value | 0.0 |
| FDR q-value | 0.0086922385 |
| FWER p-Value | 0.128 |
| PROBE | GENE SYMBOL | GENE_TITLE | RANK IN GENE LIST | RANK METRIC SCORE | RUNNING ES | CORE ENRICHMENT | |
|---|---|---|---|---|---|---|---|
| 1 | ASPM | 27 | 4.414 | 0.1704 | Yes | ||
| 2 | ATAD2 | 369 | 2.483 | 0.2514 | Yes | ||
| 3 | CEP55 | 516 | 2.255 | 0.3324 | Yes | ||
| 4 | TYMS | 530 | 2.236 | 0.4187 | Yes | ||
| 5 | SMC2 | 895 | 1.886 | 0.4754 | Yes | ||
| 6 | MCM3 | 1409 | 1.600 | 0.5142 | Yes | ||
| 7 | CCDC99 | 2042 | 1.348 | 0.5378 | Yes | ||
| 8 | BUB1 | 2260 | 1.274 | 0.5774 | Yes | ||
| 9 | CDC25B | 2332 | 1.248 | 0.6227 | Yes | ||
| 10 | KNTC1 | 4123 | 0.851 | 0.5742 | No | ||
| 11 | VEGF | 4635 | 0.767 | 0.5807 | No | ||
| 12 | TUBA3 | 4974 | 0.712 | 0.5929 | No | ||
| 13 | EXO1 | 5902 | 0.574 | 0.5730 | No | ||
| 14 | MCM7 | 5913 | 0.572 | 0.5947 | No | ||
| 15 | MCM4 | 7237 | 0.389 | 0.5495 | No | ||
| 16 | ANLN | 7835 | 0.309 | 0.5343 | No | ||
| 17 | TUBB4 | 8802 | 0.175 | 0.4970 | No | ||
| 18 | WDHD1 | 9158 | 0.126 | 0.4858 | No | ||
| 19 | PBK | 13590 | -0.459 | 0.3015 | No | ||
| 20 | AURKB | 13857 | -0.493 | 0.3086 | No | ||
| 21 | UBE2T | 14636 | -0.587 | 0.2959 | No | ||
| 22 | TUBB3 | 17457 | -0.964 | 0.2048 | No |