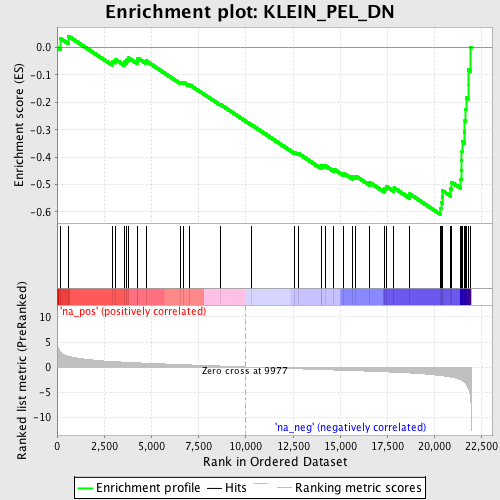
Profile of the Running ES Score & Positions of GeneSet Members on the Rank Ordered List
| Dataset | set02_ATM_minus_versus_BT_ATM_minus |
| Phenotype | NoPhenotypeAvailable |
| Upregulated in class | na_neg |
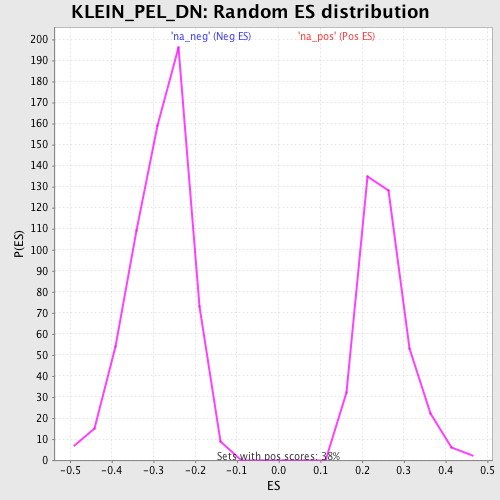
| GeneSet | KLEIN_PEL_DN |
| Enrichment Score (ES) | -0.60912853 |
| Normalized Enrichment Score (NES) | -2.1423292 |
| Nominal p-value | 0.0 |
| FDR q-value | 0.0012496796 |
| FWER p-Value | 0.02 |
| PROBE | GENE SYMBOL | GENE_TITLE | RANK IN GENE LIST | RANK METRIC SCORE | RUNNING ES | CORE ENRICHMENT | |
|---|---|---|---|---|---|---|---|
| 1 | DEK | 159 | 3.103 | 0.0336 | No | ||
| 2 | PKIG | 600 | 2.156 | 0.0418 | No | ||
| 3 | ALDH5A1 | 2915 | 1.101 | -0.0494 | No | ||
| 4 | SYPL1 | 3068 | 1.067 | -0.0423 | No | ||
| 5 | BCL11A | 3568 | 0.955 | -0.0525 | No | ||
| 6 | CCDC6 | 3679 | 0.932 | -0.0453 | No | ||
| 7 | SPIB | 3763 | 0.916 | -0.0370 | No | ||
| 8 | FADS3 | 4245 | 0.833 | -0.0480 | No | ||
| 9 | GSTP1 | 4281 | 0.824 | -0.0388 | No | ||
| 10 | ETS1 | 4712 | 0.754 | -0.0485 | No | ||
| 11 | SCRN1 | 6550 | 0.480 | -0.1260 | No | ||
| 12 | MS4A1 | 6687 | 0.461 | -0.1262 | No | ||
| 13 | CD24 | 6997 | 0.420 | -0.1348 | No | ||
| 14 | GATM | 8675 | 0.193 | -0.2088 | No | ||
| 15 | BLNK | 10309 | -0.050 | -0.2827 | No | ||
| 16 | GPX7 | 12588 | -0.343 | -0.3822 | No | ||
| 17 | POU2F2 | 12770 | -0.364 | -0.3857 | No | ||
| 18 | SIT1 | 13995 | -0.508 | -0.4349 | No | ||
| 19 | MMD | 14022 | -0.511 | -0.4294 | No | ||
| 20 | STX7 | 14206 | -0.533 | -0.4307 | No | ||
| 21 | LRMP | 14660 | -0.591 | -0.4436 | No | ||
| 22 | AES | 15196 | -0.652 | -0.4595 | No | ||
| 23 | PAWR | 15663 | -0.710 | -0.4714 | No | ||
| 24 | DBI | 15836 | -0.733 | -0.4696 | No | ||
| 25 | CD79B | 16562 | -0.830 | -0.4918 | No | ||
| 26 | BIRC3 | 17339 | -0.944 | -0.5148 | No | ||
| 27 | BCAR3 | 17447 | -0.961 | -0.5071 | No | ||
| 28 | CD19 | 17851 | -1.031 | -0.5119 | No | ||
| 29 | BLR1 | 18680 | -1.189 | -0.5341 | No | ||
| 30 | ID3 | 20325 | -1.709 | -0.5866 | Yes | ||
| 31 | CAPG | 20348 | -1.716 | -0.5651 | Yes | ||
| 32 | BTG2 | 20413 | -1.745 | -0.5451 | Yes | ||
| 33 | NCF4 | 20437 | -1.760 | -0.5230 | Yes | ||
| 34 | MAPRE2 | 20853 | -2.000 | -0.5156 | Yes | ||
| 35 | SWAP70 | 20889 | -2.026 | -0.4906 | Yes | ||
| 36 | CD40 | 21382 | -2.536 | -0.4797 | Yes | ||
| 37 | CD72 | 21419 | -2.609 | -0.4470 | Yes | ||
| 38 | SH3BP5 | 21431 | -2.642 | -0.4128 | Yes | ||
| 39 | RASSF2 | 21452 | -2.692 | -0.3783 | Yes | ||
| 40 | TNFRSF7 | 21486 | -2.756 | -0.3435 | Yes | ||
| 41 | PTPN6 | 21597 | -3.085 | -0.3080 | Yes | ||
| 42 | IRF8 | 21610 | -3.117 | -0.2675 | Yes | ||
| 43 | ZHX2 | 21654 | -3.267 | -0.2265 | Yes | ||
| 44 | CD79A | 21671 | -3.365 | -0.1830 | Yes | ||
| 45 | CTSH | 21778 | -4.077 | -0.1342 | Yes | ||
| 46 | CD52 | 21780 | -4.104 | -0.0803 | Yes | ||
| 47 | ST6GAL1 | 21925 | -6.682 | 0.0010 | Yes |