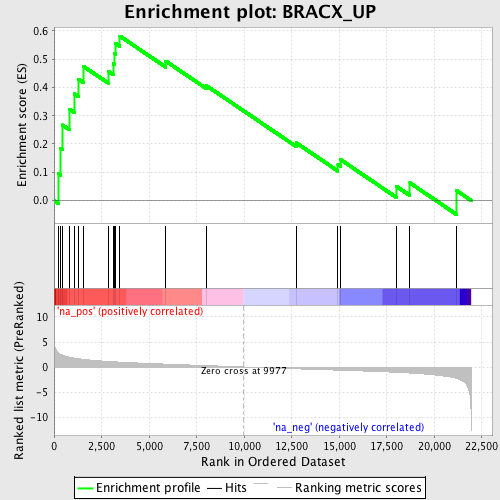
Profile of the Running ES Score & Positions of GeneSet Members on the Rank Ordered List
| Dataset | set02_ATM_minus_versus_BT_ATM_minus |
| Phenotype | NoPhenotypeAvailable |
| Upregulated in class | na_pos |
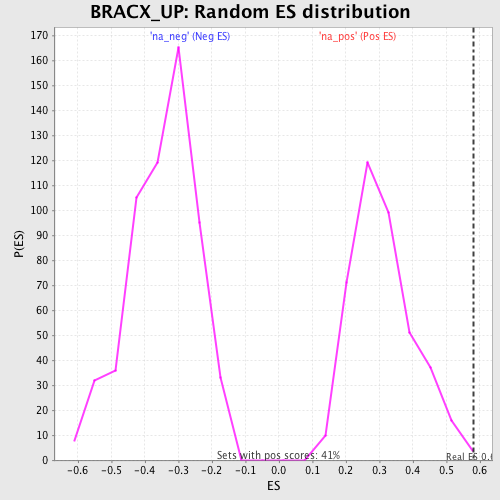
| GeneSet | BRACX_UP |
| Enrichment Score (ES) | 0.58169335 |
| Normalized Enrichment Score (NES) | 1.8603613 |
| Nominal p-value | 0.004914005 |
| FDR q-value | 0.04381277 |
| FWER p-Value | 0.728 |
| PROBE | GENE SYMBOL | GENE_TITLE | RANK IN GENE LIST | RANK METRIC SCORE | RUNNING ES | CORE ENRICHMENT | |
|---|---|---|---|---|---|---|---|
| 1 | SFRS11 | 221 | 2.840 | 0.0956 | Yes | ||
| 2 | HUWE1 | 350 | 2.517 | 0.1834 | Yes | ||
| 3 | NAP1L1 | 440 | 2.364 | 0.2673 | Yes | ||
| 4 | EDD1 | 813 | 1.953 | 0.3230 | Yes | ||
| 5 | WDR37 | 1071 | 1.774 | 0.3773 | Yes | ||
| 6 | NEK7 | 1292 | 1.658 | 0.4289 | Yes | ||
| 7 | LPHN3 | 1559 | 1.538 | 0.4740 | Yes | ||
| 8 | DLEU2 | 2846 | 1.119 | 0.4570 | Yes | ||
| 9 | CASD1 | 3124 | 1.054 | 0.4836 | Yes | ||
| 10 | FGFR1OP2 | 3171 | 1.043 | 0.5203 | Yes | ||
| 11 | NEB | 3231 | 1.030 | 0.5559 | Yes | ||
| 12 | SLC38A2 | 3464 | 0.977 | 0.5817 | Yes | ||
| 13 | EP300 | 5873 | 0.578 | 0.4934 | No | ||
| 14 | FKBP8 | 8018 | 0.285 | 0.4062 | No | ||
| 15 | HPS5 | 12734 | -0.360 | 0.2046 | No | ||
| 16 | CEPT1 | 14938 | -0.622 | 0.1273 | No | ||
| 17 | OCIAD1 | 15076 | -0.637 | 0.1447 | No | ||
| 18 | FTCD | 18001 | -1.059 | 0.0508 | No | ||
| 19 | PRPF6 | 18727 | -1.199 | 0.0623 | No | ||
| 20 | ARHGEF7 | 21179 | -2.271 | 0.0350 | No |