Profile of the Running ES Score & Positions of GeneSet Members on the Rank Ordered List
| Dataset | set01_ATM_minus_versus_SCID |
| Phenotype | NoPhenotypeAvailable |
| Upregulated in class | na_pos |
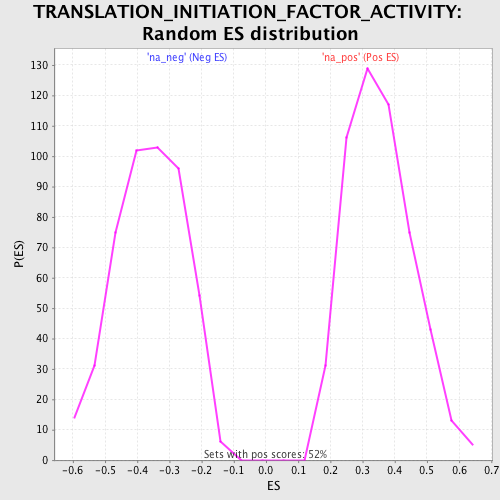
| GeneSet | TRANSLATION_INITIATION_FACTOR_ACTIVITY |
| Enrichment Score (ES) | 0.70480067 |
| Normalized Enrichment Score (NES) | 1.9955622 |
| Nominal p-value | 0.0 |
| FDR q-value | 0.024392158 |
| FWER p-Value | 0.233 |
| PROBE | GENE SYMBOL | GENE_TITLE | RANK IN GENE LIST | RANK METRIC SCORE | RUNNING ES | CORE ENRICHMENT | |
|---|---|---|---|---|---|---|---|
| 1 | EIF4G2 | 28 | 12.462 | 0.1977 | Yes | ||
| 2 | COPS5 | 237 | 7.333 | 0.3053 | Yes | ||
| 3 | EIF2A | 248 | 7.231 | 0.4203 | Yes | ||
| 4 | EIF4A2 | 356 | 6.429 | 0.5181 | Yes | ||
| 5 | EIF2S2 | 565 | 5.270 | 0.5928 | Yes | ||
| 6 | EIF2B1 | 1048 | 3.993 | 0.6346 | Yes | ||
| 7 | EIF4G1 | 1269 | 3.611 | 0.6822 | Yes | ||
| 8 | EIF2S1 | 1825 | 3.000 | 0.7048 | Yes | ||
| 9 | EIF2B3 | 2926 | 2.330 | 0.6918 | No | ||
| 10 | EIF2B2 | 4732 | 1.688 | 0.6365 | No | ||
| 11 | EIF5A | 7362 | 1.015 | 0.5328 | No | ||
| 12 | EIF2B4 | 9997 | 0.382 | 0.4188 | No | ||
| 13 | EIF2B5 | 14284 | -0.848 | 0.2370 | No | ||
| 14 | EIF2C1 | 17470 | -1.742 | 0.1196 | No | ||
| 15 | EIF4B | 18320 | -2.047 | 0.1135 | No | ||
| 16 | EIF4E | 20471 | -3.243 | 0.0673 | No |