Profile of the Running ES Score & Positions of GeneSet Members on the Rank Ordered List
| Dataset | set01_ATM_minus_versus_SCID |
| Phenotype | NoPhenotypeAvailable |
| Upregulated in class | na_pos |
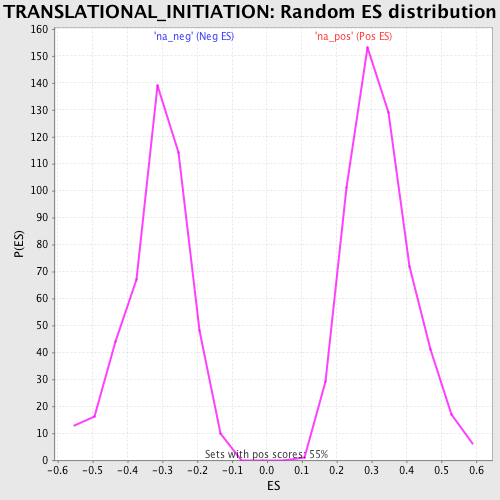
| GeneSet | TRANSLATIONAL_INITIATION |
| Enrichment Score (ES) | 0.7047731 |
| Normalized Enrichment Score (NES) | 2.1640208 |
| Nominal p-value | 0.0 |
| FDR q-value | 0.001845099 |
| FWER p-Value | 0.01 |
| PROBE | GENE SYMBOL | GENE_TITLE | RANK IN GENE LIST | RANK METRIC SCORE | RUNNING ES | CORE ENRICHMENT | |
|---|---|---|---|---|---|---|---|
| 1 | EIF4G2 | 28 | 12.462 | 0.1402 | Yes | ||
| 2 | PAIP1 | 30 | 12.308 | 0.2799 | Yes | ||
| 3 | EIF5 | 212 | 7.562 | 0.3575 | Yes | ||
| 4 | EIF1 | 355 | 6.440 | 0.4242 | Yes | ||
| 5 | EIF4A2 | 356 | 6.429 | 0.4972 | Yes | ||
| 6 | EIF4G3 | 363 | 6.393 | 0.5695 | Yes | ||
| 7 | RPS3A | 741 | 4.680 | 0.6054 | Yes | ||
| 8 | HSPB1 | 886 | 4.353 | 0.6483 | Yes | ||
| 9 | EIF2B1 | 1048 | 3.993 | 0.6863 | Yes | ||
| 10 | EIF2AK4 | 2351 | 2.614 | 0.6566 | Yes | ||
| 11 | PAIP2 | 2387 | 2.594 | 0.6845 | Yes | ||
| 12 | EIF2B3 | 2926 | 2.330 | 0.6864 | Yes | ||
| 13 | MTIF2 | 3087 | 2.263 | 0.7048 | Yes | ||
| 14 | DAZL | 4088 | 1.898 | 0.6807 | No | ||
| 15 | EIF2AK3 | 4216 | 1.859 | 0.6960 | No | ||
| 16 | EIF2B2 | 4732 | 1.688 | 0.6917 | No | ||
| 17 | EIF5A | 7362 | 1.015 | 0.5833 | No | ||
| 18 | EIF2B4 | 9997 | 0.382 | 0.4675 | No | ||
| 19 | BOLL | 13951 | -0.765 | 0.2959 | No | ||
| 20 | EIF2B5 | 14284 | -0.848 | 0.2904 | No | ||
| 21 | EIF1B | 16349 | -1.404 | 0.2122 | No | ||
| 22 | EIF2C1 | 17470 | -1.742 | 0.1809 | No | ||
| 23 | EIF4B | 18320 | -2.047 | 0.1654 | No |