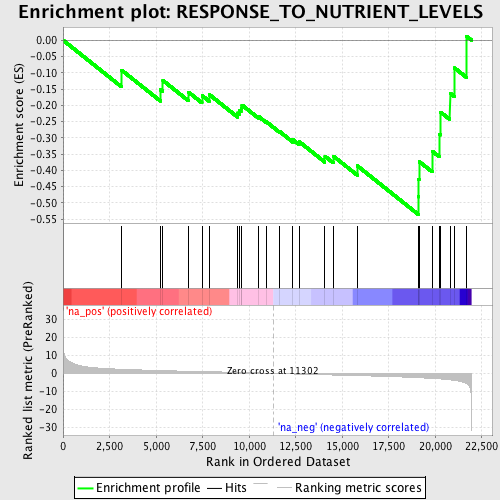
Profile of the Running ES Score & Positions of GeneSet Members on the Rank Ordered List
| Dataset | set01_ATM_minus_versus_SCID |
| Phenotype | NoPhenotypeAvailable |
| Upregulated in class | na_neg |
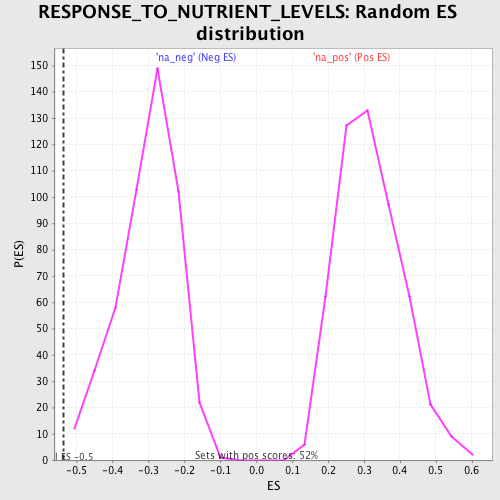
| GeneSet | RESPONSE_TO_NUTRIENT_LEVELS |
| Enrichment Score (ES) | -0.53552365 |
| Normalized Enrichment Score (NES) | -1.7877825 |
| Nominal p-value | 0.002079002 |
| FDR q-value | 0.43886673 |
| FWER p-Value | 0.928 |
| PROBE | GENE SYMBOL | GENE_TITLE | RANK IN GENE LIST | RANK METRIC SCORE | RUNNING ES | CORE ENRICHMENT | |
|---|---|---|---|---|---|---|---|
| 1 | PPARG | 3135 | 2.246 | -0.0916 | No | ||
| 2 | STC2 | 5230 | 1.535 | -0.1519 | No | ||
| 3 | TULP4 | 5362 | 1.499 | -0.1235 | No | ||
| 4 | PCSK9 | 6743 | 1.161 | -0.1599 | No | ||
| 5 | GIPR | 7464 | 0.992 | -0.1700 | No | ||
| 6 | SST | 7846 | 0.908 | -0.1666 | No | ||
| 7 | NPY | 9375 | 0.553 | -0.2236 | No | ||
| 8 | SSTR1 | 9460 | 0.534 | -0.2152 | No | ||
| 9 | GHRL | 9564 | 0.503 | -0.2084 | No | ||
| 10 | LEP | 9609 | 0.492 | -0.1991 | No | ||
| 11 | CDKN2B | 10492 | 0.242 | -0.2338 | No | ||
| 12 | CCKAR | 10910 | 0.116 | -0.2502 | No | ||
| 13 | CARTPT | 11644 | -0.107 | -0.2811 | No | ||
| 14 | ASNS | 12348 | -0.318 | -0.3059 | No | ||
| 15 | ENPP1 | 12681 | -0.416 | -0.3115 | No | ||
| 16 | GCGR | 14069 | -0.796 | -0.3566 | No | ||
| 17 | SSTR2 | 14522 | -0.914 | -0.3562 | No | ||
| 18 | NUAK2 | 15806 | -1.262 | -0.3858 | No | ||
| 19 | STC1 | 19088 | -2.384 | -0.4809 | Yes | ||
| 20 | GHSR | 19109 | -2.393 | -0.4270 | Yes | ||
| 21 | SREBF1 | 19131 | -2.408 | -0.3728 | Yes | ||
| 22 | FADS1 | 19835 | -2.789 | -0.3409 | Yes | ||
| 23 | GNAI2 | 20222 | -3.043 | -0.2888 | Yes | ||
| 24 | CDKN2D | 20278 | -3.082 | -0.2207 | Yes | ||
| 25 | ENSA | 20788 | -3.553 | -0.1625 | Yes | ||
| 26 | OGT | 21032 | -3.865 | -0.0851 | Yes | ||
| 27 | TP53 | 21670 | -5.532 | 0.0126 | Yes |