Profile of the Running ES Score & Positions of GeneSet Members on the Rank Ordered List
| Dataset | set01_ATM_minus_versus_SCID |
| Phenotype | NoPhenotypeAvailable |
| Upregulated in class | na_pos |
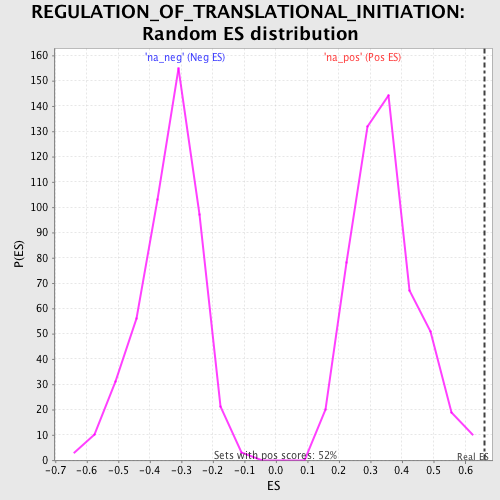
| GeneSet | REGULATION_OF_TRANSLATIONAL_INITIATION |
| Enrichment Score (ES) | 0.663219 |
| Normalized Enrichment Score (NES) | 1.9183733 |
| Nominal p-value | 0.0 |
| FDR q-value | 0.045584626 |
| FWER p-Value | 0.521 |
| PROBE | GENE SYMBOL | GENE_TITLE | RANK IN GENE LIST | RANK METRIC SCORE | RUNNING ES | CORE ENRICHMENT | |
|---|---|---|---|---|---|---|---|
| 1 | EIF4G2 | 28 | 12.462 | 0.1923 | Yes | ||
| 2 | EIF5 | 212 | 7.562 | 0.3014 | Yes | ||
| 3 | EIF1 | 355 | 6.440 | 0.3950 | Yes | ||
| 4 | EIF4A2 | 356 | 6.429 | 0.4949 | Yes | ||
| 5 | EIF4G3 | 363 | 6.393 | 0.5939 | Yes | ||
| 6 | HSPB1 | 886 | 4.353 | 0.6377 | Yes | ||
| 7 | EIF2AK4 | 2351 | 2.614 | 0.6115 | Yes | ||
| 8 | PAIP2 | 2387 | 2.594 | 0.6502 | Yes | ||
| 9 | MTIF2 | 3087 | 2.263 | 0.6535 | Yes | ||
| 10 | DAZL | 4088 | 1.898 | 0.6374 | Yes | ||
| 11 | EIF2AK3 | 4216 | 1.859 | 0.6605 | Yes | ||
| 12 | EIF2B2 | 4732 | 1.688 | 0.6632 | Yes | ||
| 13 | EIF5A | 7362 | 1.015 | 0.5591 | No | ||
| 14 | BOLL | 13951 | -0.765 | 0.2706 | No | ||
| 15 | EIF2B5 | 14284 | -0.848 | 0.2686 | No | ||
| 16 | EIF1B | 16349 | -1.404 | 0.1963 | No | ||
| 17 | EIF2C1 | 17470 | -1.742 | 0.1723 | No | ||
| 18 | EIF4B | 18320 | -2.047 | 0.1654 | No |