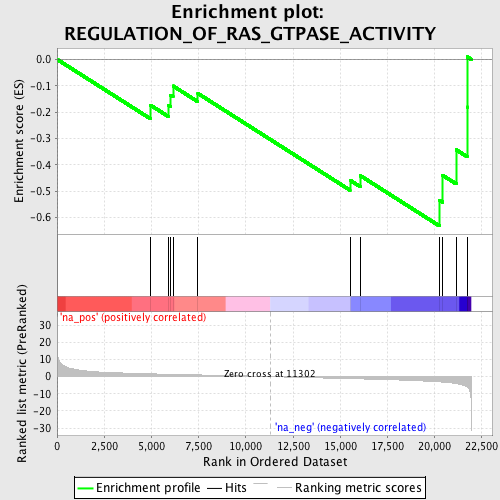
Profile of the Running ES Score & Positions of GeneSet Members on the Rank Ordered List
| Dataset | set01_ATM_minus_versus_SCID |
| Phenotype | NoPhenotypeAvailable |
| Upregulated in class | na_neg |
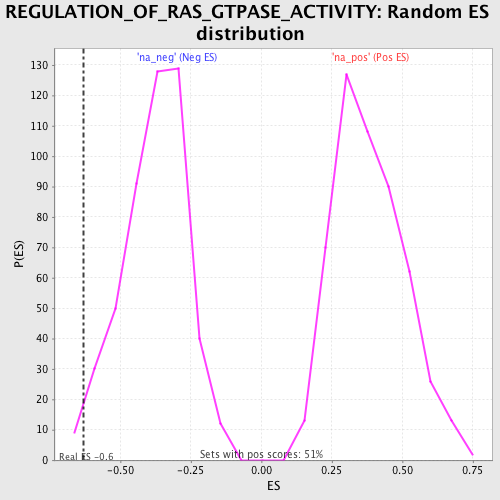
| GeneSet | REGULATION_OF_RAS_GTPASE_ACTIVITY |
| Enrichment Score (ES) | -0.63235074 |
| Normalized Enrichment Score (NES) | -1.6757863 |
| Nominal p-value | 0.018404908 |
| FDR q-value | 0.30371755 |
| FWER p-Value | 1.0 |
| PROBE | GENE SYMBOL | GENE_TITLE | RANK IN GENE LIST | RANK METRIC SCORE | RUNNING ES | CORE ENRICHMENT | |
|---|---|---|---|---|---|---|---|
| 1 | FGD4 | 4942 | 1.623 | -0.1735 | No | ||
| 2 | FGD2 | 5891 | 1.359 | -0.1734 | No | ||
| 3 | RALBP1 | 6008 | 1.332 | -0.1362 | No | ||
| 4 | FGD6 | 6144 | 1.300 | -0.1009 | No | ||
| 5 | FGD5 | 7460 | 0.993 | -0.1292 | No | ||
| 6 | NF1 | 15523 | -1.189 | -0.4588 | No | ||
| 7 | FGD1 | 16063 | -1.326 | -0.4411 | No | ||
| 8 | ALS2 | 20260 | -3.065 | -0.5346 | Yes | ||
| 9 | FGD3 | 20432 | -3.204 | -0.4402 | Yes | ||
| 10 | CENTD2 | 21152 | -4.063 | -0.3434 | Yes | ||
| 11 | TSC1 | 21728 | -5.921 | -0.1807 | Yes | ||
| 12 | ARHGAP27 | 21736 | -5.977 | 0.0096 | Yes |