Profile of the Running ES Score & Positions of GeneSet Members on the Rank Ordered List
| Dataset | set01_ATM_minus_versus_SCID |
| Phenotype | NoPhenotypeAvailable |
| Upregulated in class | na_pos |
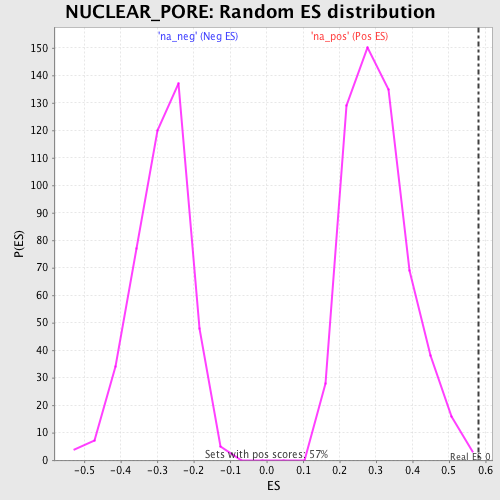
| GeneSet | NUCLEAR_PORE |
| Enrichment Score (ES) | 0.58072543 |
| Normalized Enrichment Score (NES) | 1.9092021 |
| Nominal p-value | 0.0035211267 |
| FDR q-value | 0.04841435 |
| FWER p-Value | 0.565 |
| PROBE | GENE SYMBOL | GENE_TITLE | RANK IN GENE LIST | RANK METRIC SCORE | RUNNING ES | CORE ENRICHMENT | |
|---|---|---|---|---|---|---|---|
| 1 | NUP54 | 110 | 9.075 | 0.0784 | Yes | ||
| 2 | KPNA3 | 138 | 8.635 | 0.1566 | Yes | ||
| 3 | NUP160 | 274 | 7.038 | 0.2152 | Yes | ||
| 4 | KPNB1 | 470 | 5.778 | 0.2594 | Yes | ||
| 5 | NUP153 | 524 | 5.472 | 0.3073 | Yes | ||
| 6 | HRB | 644 | 4.951 | 0.3474 | Yes | ||
| 7 | RANBP5 | 953 | 4.185 | 0.3718 | Yes | ||
| 8 | KPNA1 | 973 | 4.137 | 0.4090 | Yes | ||
| 9 | NUP98 | 1125 | 3.851 | 0.4375 | Yes | ||
| 10 | IPO7 | 1127 | 3.845 | 0.4728 | Yes | ||
| 11 | NUP133 | 1301 | 3.558 | 0.4977 | Yes | ||
| 12 | NUP88 | 1306 | 3.552 | 0.5301 | Yes | ||
| 13 | DDX19B | 1434 | 3.392 | 0.5555 | Yes | ||
| 14 | TMEM48 | 2053 | 2.807 | 0.5531 | Yes | ||
| 15 | TPR | 2274 | 2.659 | 0.5676 | Yes | ||
| 16 | SENP2 | 2498 | 2.538 | 0.5807 | Yes | ||
| 17 | EIF5A | 7362 | 1.015 | 0.3682 | No | ||
| 18 | NUP107 | 11085 | 0.067 | 0.1990 | No | ||
| 19 | NXT1 | 12219 | -0.279 | 0.1499 | No | ||
| 20 | XPO7 | 13609 | -0.674 | 0.0927 | No | ||
| 21 | NUP50 | 17867 | -1.876 | -0.0843 | No | ||
| 22 | NUP62 | 19937 | -2.850 | -0.1525 | No | ||
| 23 | RANGAP1 | 20085 | -2.958 | -0.1320 | No | ||
| 24 | SNUPN | 20202 | -3.034 | -0.1094 | No | ||
| 25 | RANBP2 | 20315 | -3.112 | -0.0859 | No | ||
| 26 | SUMO1 | 20323 | -3.118 | -0.0575 | No | ||
| 27 | NUP214 | 20503 | -3.276 | -0.0356 | No | ||
| 28 | AAAS | 20599 | -3.358 | -0.0090 | No | ||
| 29 | NUTF2 | 20850 | -3.630 | 0.0130 | No | ||
| 30 | RAE1 | 21136 | -4.030 | 0.0370 | No |