Profile of the Running ES Score & Positions of GeneSet Members on the Rank Ordered List
| Dataset | set01_ATM_minus_versus_SCID |
| Phenotype | NoPhenotypeAvailable |
| Upregulated in class | na_pos |
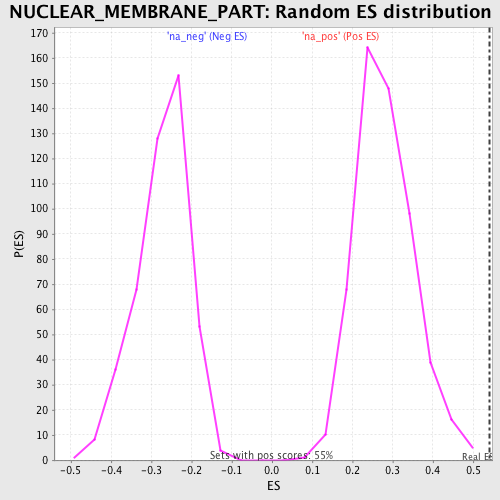
| GeneSet | NUCLEAR_MEMBRANE_PART |
| Enrichment Score (ES) | 0.5420431 |
| Normalized Enrichment Score (NES) | 1.9323645 |
| Nominal p-value | 0.0 |
| FDR q-value | 0.04338195 |
| FWER p-Value | 0.461 |
| PROBE | GENE SYMBOL | GENE_TITLE | RANK IN GENE LIST | RANK METRIC SCORE | RUNNING ES | CORE ENRICHMENT | |
|---|---|---|---|---|---|---|---|
| 1 | MATR3 | 98 | 9.240 | 0.0670 | Yes | ||
| 2 | NUP54 | 110 | 9.075 | 0.1367 | Yes | ||
| 3 | KPNA3 | 138 | 8.635 | 0.2023 | Yes | ||
| 4 | NUP160 | 274 | 7.038 | 0.2506 | Yes | ||
| 5 | KPNB1 | 470 | 5.778 | 0.2864 | Yes | ||
| 6 | NUP153 | 524 | 5.472 | 0.3263 | Yes | ||
| 7 | HRB | 644 | 4.951 | 0.3591 | Yes | ||
| 8 | RANBP5 | 953 | 4.185 | 0.3775 | Yes | ||
| 9 | KPNA1 | 973 | 4.137 | 0.4086 | Yes | ||
| 10 | NUP98 | 1125 | 3.851 | 0.4315 | Yes | ||
| 11 | IPO7 | 1127 | 3.845 | 0.4612 | Yes | ||
| 12 | NUP133 | 1301 | 3.558 | 0.4808 | Yes | ||
| 13 | NUP88 | 1306 | 3.552 | 0.5081 | Yes | ||
| 14 | DDX19B | 1434 | 3.392 | 0.5286 | Yes | ||
| 15 | TMEM48 | 2053 | 2.807 | 0.5221 | Yes | ||
| 16 | TPR | 2274 | 2.659 | 0.5326 | Yes | ||
| 17 | SENP2 | 2498 | 2.538 | 0.5420 | Yes | ||
| 18 | PSEN2 | 3172 | 2.230 | 0.5286 | No | ||
| 19 | RETSAT | 6231 | 1.278 | 0.3989 | No | ||
| 20 | EIF5A | 7362 | 1.015 | 0.3552 | No | ||
| 21 | LBR | 10783 | 0.159 | 0.2003 | No | ||
| 22 | NUP107 | 11085 | 0.067 | 0.1871 | No | ||
| 23 | NXT1 | 12219 | -0.279 | 0.1375 | No | ||
| 24 | XPO7 | 13609 | -0.674 | 0.0793 | No | ||
| 25 | NARF | 14094 | -0.801 | 0.0634 | No | ||
| 26 | PSEN1 | 14153 | -0.817 | 0.0671 | No | ||
| 27 | LMNB1 | 14609 | -0.933 | 0.0536 | No | ||
| 28 | LEMD3 | 16261 | -1.379 | -0.0111 | No | ||
| 29 | NUP50 | 17867 | -1.876 | -0.0699 | No | ||
| 30 | NUP62 | 19937 | -2.850 | -0.1423 | No | ||
| 31 | RANGAP1 | 20085 | -2.958 | -0.1261 | No | ||
| 32 | SNUPN | 20202 | -3.034 | -0.1079 | No | ||
| 33 | RANBP2 | 20315 | -3.112 | -0.0889 | No | ||
| 34 | SUMO1 | 20323 | -3.118 | -0.0651 | No | ||
| 35 | NUP214 | 20503 | -3.276 | -0.0480 | No | ||
| 36 | AAAS | 20599 | -3.358 | -0.0263 | No | ||
| 37 | NUTF2 | 20850 | -3.630 | -0.0097 | No | ||
| 38 | DHCR7 | 20894 | -3.680 | 0.0168 | No | ||
| 39 | RAE1 | 21136 | -4.030 | 0.0370 | No |