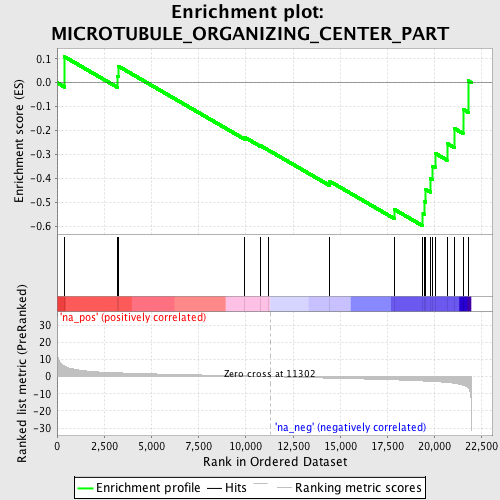
Profile of the Running ES Score & Positions of GeneSet Members on the Rank Ordered List
| Dataset | set01_ATM_minus_versus_SCID |
| Phenotype | NoPhenotypeAvailable |
| Upregulated in class | na_neg |
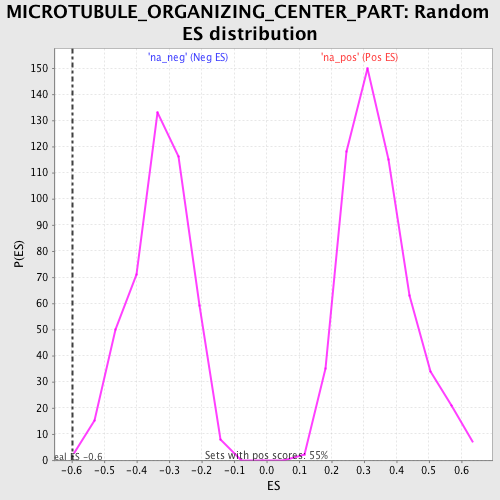
| GeneSet | MICROTUBULE_ORGANIZING_CENTER_PART |
| Enrichment Score (ES) | -0.59799266 |
| Normalized Enrichment Score (NES) | -1.8027335 |
| Nominal p-value | 0.0021978023 |
| FDR q-value | 0.632605 |
| FWER p-Value | 0.899 |
| PROBE | GENE SYMBOL | GENE_TITLE | RANK IN GENE LIST | RANK METRIC SCORE | RUNNING ES | CORE ENRICHMENT | |
|---|---|---|---|---|---|---|---|
| 1 | CETN3 | 402 | 6.168 | 0.1080 | No | ||
| 2 | TUBGCP5 | 3188 | 2.226 | 0.0266 | No | ||
| 3 | BBS4 | 3238 | 2.206 | 0.0695 | No | ||
| 4 | UXT | 9922 | 0.404 | -0.2270 | No | ||
| 5 | BIRC5 | 10791 | 0.157 | -0.2634 | No | ||
| 6 | TUBG1 | 11222 | 0.021 | -0.2825 | No | ||
| 7 | TUBD1 | 14426 | -0.885 | -0.4105 | No | ||
| 8 | TUBGCP3 | 17889 | -1.886 | -0.5297 | No | ||
| 9 | CKAP5 | 19387 | -2.540 | -0.5460 | Yes | ||
| 10 | TUBE1 | 19488 | -2.601 | -0.4973 | Yes | ||
| 11 | TOP2A | 19518 | -2.617 | -0.4450 | Yes | ||
| 12 | PCM1 | 19770 | -2.751 | -0.4001 | Yes | ||
| 13 | KATNB1 | 19886 | -2.819 | -0.3477 | Yes | ||
| 14 | MARK4 | 20034 | -2.916 | -0.2947 | Yes | ||
| 15 | TUBGCP6 | 20664 | -3.417 | -0.2534 | Yes | ||
| 16 | CROCC | 21063 | -3.916 | -0.1913 | Yes | ||
| 17 | CNTROB | 21513 | -4.931 | -0.1108 | Yes | ||
| 18 | LCK | 21782 | -6.376 | 0.0075 | Yes |