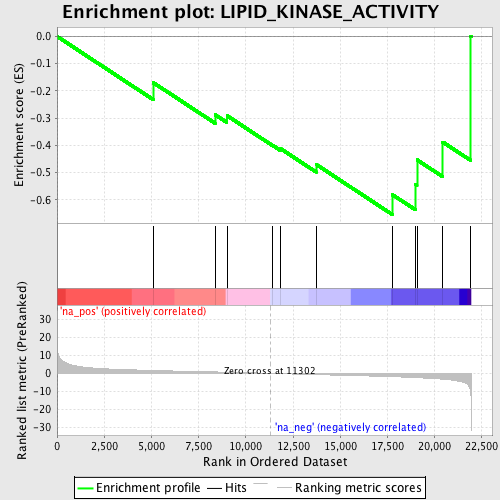
Profile of the Running ES Score & Positions of GeneSet Members on the Rank Ordered List
| Dataset | set01_ATM_minus_versus_SCID |
| Phenotype | NoPhenotypeAvailable |
| Upregulated in class | na_neg |
| GeneSet | LIPID_KINASE_ACTIVITY |
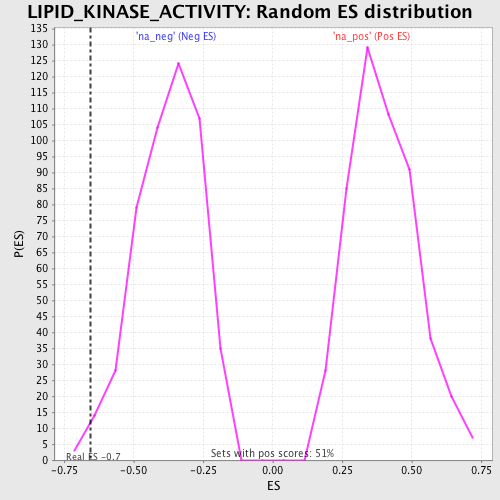
| Enrichment Score (ES) | -0.65387446 |
| Normalized Enrichment Score (NES) | -1.7491959 |
| Nominal p-value | 0.010121457 |
| FDR q-value | 0.34585992 |
| FWER p-Value | 0.977 |
| PROBE | GENE SYMBOL | GENE_TITLE | RANK IN GENE LIST | RANK METRIC SCORE | RUNNING ES | CORE ENRICHMENT | |
|---|---|---|---|---|---|---|---|
| 1 | PIK3C2A | 5091 | 1.576 | -0.1694 | No | ||
| 2 | PIK3R2 | 8374 | 0.789 | -0.2877 | No | ||
| 3 | PIK3R3 | 9002 | 0.639 | -0.2909 | No | ||
| 4 | SPHK1 | 11395 | -0.030 | -0.3988 | No | ||
| 5 | PIK3C3 | 11853 | -0.173 | -0.4127 | No | ||
| 6 | PIK3CG | 13727 | -0.706 | -0.4701 | No | ||
| 7 | PIK3CB | 17760 | -1.839 | -0.5808 | Yes | ||
| 8 | CERK | 18999 | -2.340 | -0.5443 | Yes | ||
| 9 | PIP5K3 | 19071 | -2.375 | -0.4531 | Yes | ||
| 10 | PIK3CA | 20435 | -3.207 | -0.3878 | Yes | ||
| 11 | ATM | 21922 | -11.494 | 0.0011 | Yes |