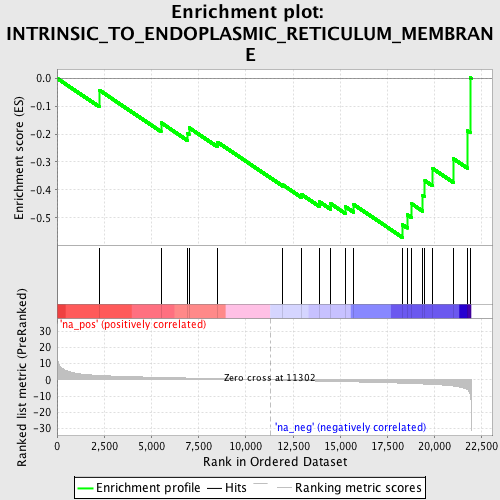
Profile of the Running ES Score & Positions of GeneSet Members on the Rank Ordered List
| Dataset | set01_ATM_minus_versus_SCID |
| Phenotype | NoPhenotypeAvailable |
| Upregulated in class | na_neg |
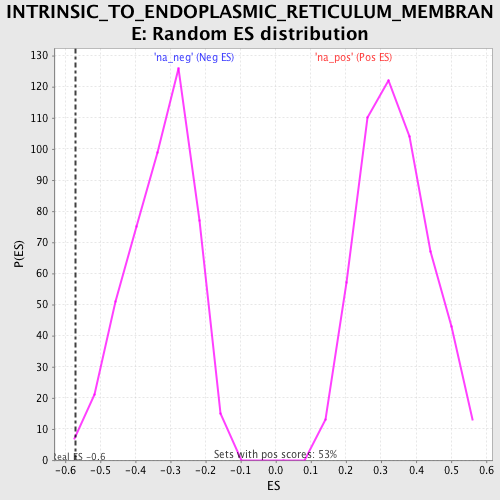
| GeneSet | INTRINSIC_TO_ENDOPLASMIC_RETICULUM_MEMBRANE |
| Enrichment Score (ES) | -0.5706752 |
| Normalized Enrichment Score (NES) | -1.7389066 |
| Nominal p-value | 0.006369427 |
| FDR q-value | 0.3079814 |
| FWER p-Value | 0.982 |
| PROBE | GENE SYMBOL | GENE_TITLE | RANK IN GENE LIST | RANK METRIC SCORE | RUNNING ES | CORE ENRICHMENT | |
|---|---|---|---|---|---|---|---|
| 1 | PIGK | 2229 | 2.683 | -0.0419 | No | ||
| 2 | RTN1 | 5510 | 1.457 | -0.1590 | No | ||
| 3 | SPCS1 | 6892 | 1.124 | -0.1970 | No | ||
| 4 | PIGS | 6993 | 1.101 | -0.1770 | No | ||
| 5 | DERL3 | 8509 | 0.759 | -0.2292 | No | ||
| 6 | AMFR | 11964 | -0.201 | -0.3822 | No | ||
| 7 | DOLPP1 | 12960 | -0.492 | -0.4167 | No | ||
| 8 | PIGT | 13907 | -0.755 | -0.4430 | No | ||
| 9 | EDEM1 | 14498 | -0.908 | -0.4497 | No | ||
| 10 | BNIP1 | 15272 | -1.121 | -0.4600 | No | ||
| 11 | DERL2 | 15712 | -1.234 | -0.4525 | No | ||
| 12 | DPM3 | 18304 | -2.040 | -0.5252 | Yes | ||
| 13 | DERL1 | 18560 | -2.142 | -0.4892 | Yes | ||
| 14 | GPAA1 | 18772 | -2.231 | -0.4491 | Yes | ||
| 15 | BSCL2 | 19377 | -2.534 | -0.4202 | Yes | ||
| 16 | ERN1 | 19490 | -2.602 | -0.3674 | Yes | ||
| 17 | STIM1 | 19882 | -2.817 | -0.3225 | Yes | ||
| 18 | RTN4 | 20996 | -3.813 | -0.2884 | Yes | ||
| 19 | CLN3 | 21742 | -6.016 | -0.1884 | Yes | ||
| 20 | EXT1 | 21887 | -8.877 | 0.0027 | Yes |