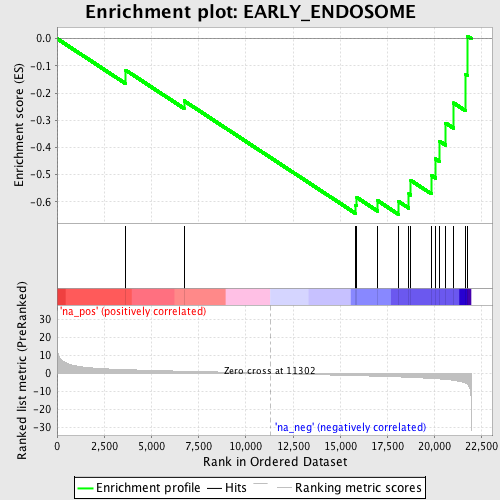
Profile of the Running ES Score & Positions of GeneSet Members on the Rank Ordered List
| Dataset | set01_ATM_minus_versus_SCID |
| Phenotype | NoPhenotypeAvailable |
| Upregulated in class | na_neg |
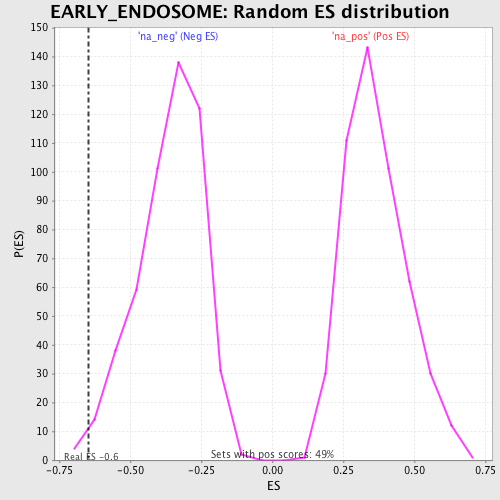
| GeneSet | EARLY_ENDOSOME |
| Enrichment Score (ES) | -0.6467593 |
| Normalized Enrichment Score (NES) | -1.7926697 |
| Nominal p-value | 0.007858546 |
| FDR q-value | 0.52297246 |
| FWER p-Value | 0.918 |
| PROBE | GENE SYMBOL | GENE_TITLE | RANK IN GENE LIST | RANK METRIC SCORE | RUNNING ES | CORE ENRICHMENT | |
|---|---|---|---|---|---|---|---|
| 1 | WDFY1 | 3639 | 2.047 | -0.1162 | No | ||
| 2 | DNER | 6730 | 1.164 | -0.2288 | No | ||
| 3 | NF2 | 15820 | -1.265 | -0.6124 | Yes | ||
| 4 | LDLRAP1 | 15883 | -1.280 | -0.5841 | Yes | ||
| 5 | STEAP2 | 16991 | -1.582 | -0.5962 | Yes | ||
| 6 | RABEP1 | 18102 | -1.958 | -0.5992 | Yes | ||
| 7 | VAMP8 | 18641 | -2.180 | -0.5707 | Yes | ||
| 8 | SNX17 | 18745 | -2.223 | -0.5214 | Yes | ||
| 9 | CTNS | 19842 | -2.792 | -0.5035 | Yes | ||
| 10 | RAB22A | 20059 | -2.931 | -0.4421 | Yes | ||
| 11 | ALS2 | 20260 | -3.065 | -0.3768 | Yes | ||
| 12 | STX6 | 20587 | -3.344 | -0.3104 | Yes | ||
| 13 | RAB14 | 21014 | -3.839 | -0.2365 | Yes | ||
| 14 | ANKRD27 | 21656 | -5.464 | -0.1330 | Yes | ||
| 15 | CLN3 | 21742 | -6.016 | 0.0093 | Yes |