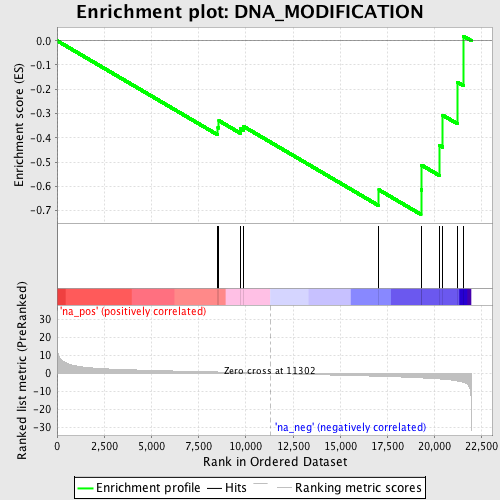
Profile of the Running ES Score & Positions of GeneSet Members on the Rank Ordered List
| Dataset | set01_ATM_minus_versus_SCID |
| Phenotype | NoPhenotypeAvailable |
| Upregulated in class | na_neg |
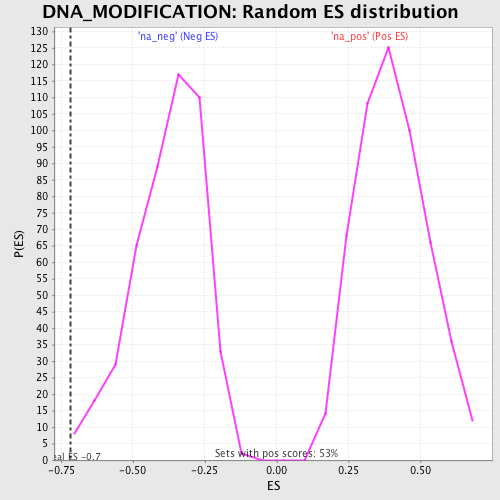
| GeneSet | DNA_MODIFICATION |
| Enrichment Score (ES) | -0.716051 |
| Normalized Enrichment Score (NES) | -1.9014567 |
| Nominal p-value | 0.008492569 |
| FDR q-value | 0.6659065 |
| FWER p-Value | 0.533 |
| PROBE | GENE SYMBOL | GENE_TITLE | RANK IN GENE LIST | RANK METRIC SCORE | RUNNING ES | CORE ENRICHMENT | |
|---|---|---|---|---|---|---|---|
| 1 | NP | 8522 | 0.755 | -0.3575 | No | ||
| 2 | FOS | 8574 | 0.740 | -0.3295 | No | ||
| 3 | PICK1 | 9720 | 0.459 | -0.3629 | No | ||
| 4 | DMAP1 | 9871 | 0.416 | -0.3527 | No | ||
| 5 | ATF7IP | 17055 | -1.602 | -0.6145 | Yes | ||
| 6 | HELLS | 19283 | -2.494 | -0.6139 | Yes | ||
| 7 | DNMT3A | 19318 | -2.507 | -0.5128 | Yes | ||
| 8 | DNMT3B | 20249 | -3.058 | -0.4300 | Yes | ||
| 9 | ATRX | 20438 | -3.209 | -0.3071 | Yes | ||
| 10 | GATAD2A | 21221 | -4.182 | -0.1715 | Yes | ||
| 11 | DNMT1 | 21530 | -4.995 | 0.0190 | Yes |