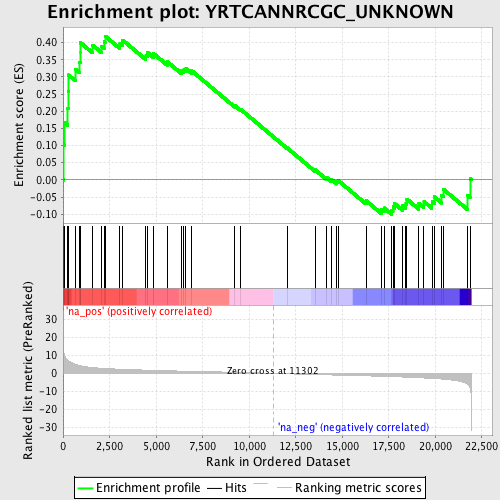
Profile of the Running ES Score & Positions of GeneSet Members on the Rank Ordered List
| Dataset | set01_ATM_minus_versus_SCID |
| Phenotype | NoPhenotypeAvailable |
| Upregulated in class | na_pos |
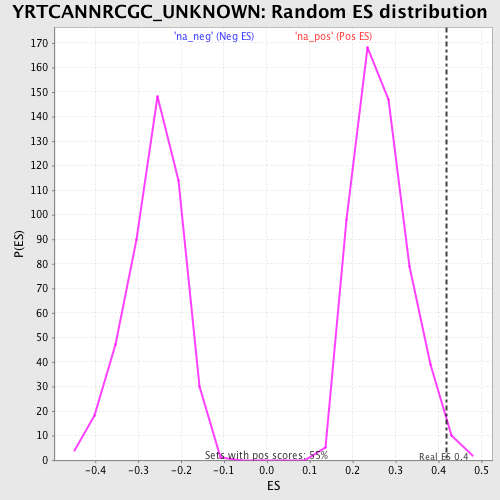
| GeneSet | YRTCANNRCGC_UNKNOWN |
| Enrichment Score (ES) | 0.41907847 |
| Normalized Enrichment Score (NES) | 1.5645688 |
| Nominal p-value | 0.018248174 |
| FDR q-value | 0.114966206 |
| FWER p-Value | 0.874 |
| PROBE | GENE SYMBOL | GENE_TITLE | RANK IN GENE LIST | RANK METRIC SCORE | RUNNING ES | CORE ENRICHMENT | |
|---|---|---|---|---|---|---|---|
| 1 | PTPN2 | 14 | 14.889 | 0.1032 | Yes | ||
| 2 | STYX | 84 | 9.621 | 0.1671 | Yes | ||
| 3 | PPHLN1 | 255 | 7.130 | 0.2091 | Yes | ||
| 4 | PITPNB | 267 | 7.084 | 0.2580 | Yes | ||
| 5 | ARIH1 | 286 | 6.974 | 0.3058 | Yes | ||
| 6 | APPBP2 | 669 | 4.907 | 0.3226 | Yes | ||
| 7 | DNAJA2 | 878 | 4.367 | 0.3436 | Yes | ||
| 8 | ELOVL5 | 932 | 4.218 | 0.3706 | Yes | ||
| 9 | SMARCAD1 | 934 | 4.217 | 0.3999 | Yes | ||
| 10 | UBE2S | 1587 | 3.216 | 0.3926 | Yes | ||
| 11 | OSR1 | 2071 | 2.789 | 0.3900 | Yes | ||
| 12 | PELP1 | 2203 | 2.695 | 0.4028 | Yes | ||
| 13 | DHX40 | 2255 | 2.671 | 0.4191 | Yes | ||
| 14 | NR2E1 | 3053 | 2.277 | 0.3986 | No | ||
| 15 | RASGRF1 | 3200 | 2.220 | 0.4074 | No | ||
| 16 | GRM7 | 4452 | 1.782 | 0.3627 | No | ||
| 17 | GPM6B | 4530 | 1.761 | 0.3715 | No | ||
| 18 | UCHL1 | 4845 | 1.656 | 0.3687 | No | ||
| 19 | SUV39H2 | 5592 | 1.435 | 0.3446 | No | ||
| 20 | PFKFB3 | 6370 | 1.247 | 0.3178 | No | ||
| 21 | FLNC | 6494 | 1.218 | 0.3207 | No | ||
| 22 | TACC1 | 6600 | 1.197 | 0.3243 | No | ||
| 23 | GNAO1 | 6917 | 1.118 | 0.3176 | No | ||
| 24 | NARG2 | 9225 | 0.587 | 0.2164 | No | ||
| 25 | SULT4A1 | 9549 | 0.508 | 0.2052 | No | ||
| 26 | SLC6A15 | 12038 | -0.222 | 0.0931 | No | ||
| 27 | TRIM46 | 13543 | -0.661 | 0.0290 | No | ||
| 28 | RNF38 | 14128 | -0.811 | 0.0080 | No | ||
| 29 | PITPNM1 | 14398 | -0.877 | 0.0019 | No | ||
| 30 | VGLL2 | 14704 | -0.959 | -0.0054 | No | ||
| 31 | CPZ | 14782 | -0.981 | -0.0021 | No | ||
| 32 | NCDN | 16277 | -1.383 | -0.0606 | No | ||
| 33 | PARD6A | 17101 | -1.618 | -0.0869 | No | ||
| 34 | LEMD2 | 17246 | -1.663 | -0.0819 | No | ||
| 35 | KRTCAP2 | 17664 | -1.804 | -0.0884 | No | ||
| 36 | FOXP2 | 17726 | -1.828 | -0.0784 | No | ||
| 37 | UBE2H | 17821 | -1.857 | -0.0697 | No | ||
| 38 | MMD | 18236 | -2.008 | -0.0746 | No | ||
| 39 | SLC25A12 | 18422 | -2.087 | -0.0685 | No | ||
| 40 | NCAM1 | 18473 | -2.109 | -0.0561 | No | ||
| 41 | BAHD1 | 19118 | -2.400 | -0.0688 | No | ||
| 42 | SLC25A28 | 19390 | -2.542 | -0.0634 | No | ||
| 43 | GNB1 | 19821 | -2.776 | -0.0637 | No | ||
| 44 | PPP2CA | 19945 | -2.853 | -0.0494 | No | ||
| 45 | SRRM2 | 20345 | -3.133 | -0.0458 | No | ||
| 46 | CDKAL1 | 20425 | -3.192 | -0.0271 | No | ||
| 47 | DPYSL2 | 21727 | -5.920 | -0.0452 | No | ||
| 48 | NDEL1 | 21868 | -7.921 | 0.0036 | No |