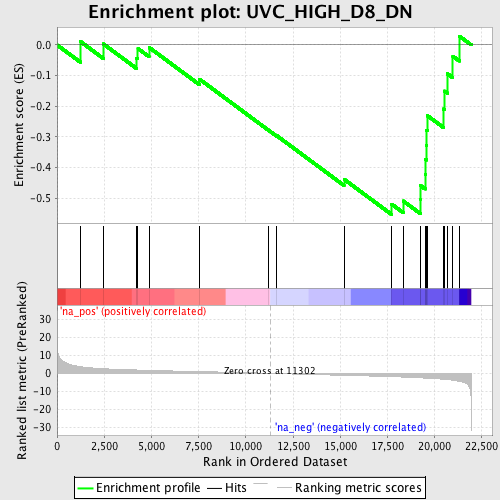
Profile of the Running ES Score & Positions of GeneSet Members on the Rank Ordered List
| Dataset | set01_ATM_minus_versus_SCID |
| Phenotype | NoPhenotypeAvailable |
| Upregulated in class | na_neg |
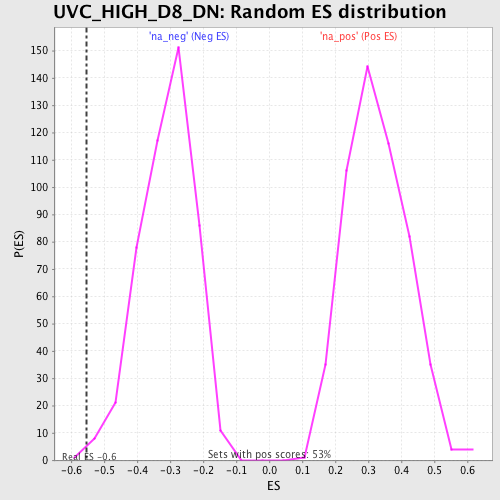
| GeneSet | UVC_HIGH_D8_DN |
| Enrichment Score (ES) | -0.5528243 |
| Normalized Enrichment Score (NES) | -1.7865182 |
| Nominal p-value | 0.0042283298 |
| FDR q-value | 0.2854987 |
| FWER p-Value | 0.96 |
| PROBE | GENE SYMBOL | GENE_TITLE | RANK IN GENE LIST | RANK METRIC SCORE | RUNNING ES | CORE ENRICHMENT | |
|---|---|---|---|---|---|---|---|
| 1 | YY1 | 1248 | 3.639 | 0.0106 | No | ||
| 2 | NR2F2 | 2450 | 2.562 | 0.0034 | No | ||
| 3 | PPP1R12A | 4219 | 1.858 | -0.0427 | No | ||
| 4 | MARCKS | 4285 | 1.832 | -0.0117 | No | ||
| 5 | CDYL | 4873 | 1.645 | -0.0079 | No | ||
| 6 | MN1 | 7537 | 0.980 | -0.1112 | No | ||
| 7 | SQLE | 11220 | 0.023 | -0.2787 | No | ||
| 8 | TWIST1 | 11637 | -0.106 | -0.2957 | No | ||
| 9 | CBX3 | 15206 | -1.103 | -0.4380 | No | ||
| 10 | IRS1 | 17725 | -1.828 | -0.5189 | Yes | ||
| 11 | REV3L | 18340 | -2.055 | -0.5087 | Yes | ||
| 12 | HMGCR | 19246 | -2.472 | -0.5041 | Yes | ||
| 13 | PARP1 | 19253 | -2.476 | -0.4584 | Yes | ||
| 14 | TSPAN5 | 19503 | -2.607 | -0.4214 | Yes | ||
| 15 | TOP2A | 19518 | -2.617 | -0.3735 | Yes | ||
| 16 | RBM15B | 19560 | -2.638 | -0.3264 | Yes | ||
| 17 | EMP1 | 19577 | -2.647 | -0.2779 | Yes | ||
| 18 | MAPK14 | 19612 | -2.666 | -0.2300 | Yes | ||
| 19 | ARHGEF7 | 20465 | -3.239 | -0.2087 | Yes | ||
| 20 | FYN | 20519 | -3.289 | -0.1501 | Yes | ||
| 21 | SPRED2 | 20681 | -3.429 | -0.0938 | Yes | ||
| 22 | STK38 | 20973 | -3.779 | -0.0369 | Yes | ||
| 23 | STK24 | 21315 | -4.380 | 0.0288 | Yes |