Profile of the Running ES Score & Positions of GeneSet Members on the Rank Ordered List
| Dataset | set01_ATM_minus_versus_SCID |
| Phenotype | NoPhenotypeAvailable |
| Upregulated in class | na_pos |
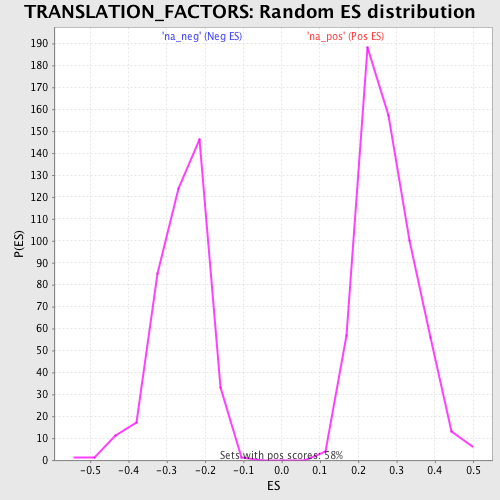
| GeneSet | TRANSLATION_FACTORS |
| Enrichment Score (ES) | 0.6265153 |
| Normalized Enrichment Score (NES) | 2.2742004 |
| Nominal p-value | 0.0 |
| FDR q-value | 4.0753168E-4 |
| FWER p-Value | 0.0020 |
| PROBE | GENE SYMBOL | GENE_TITLE | RANK IN GENE LIST | RANK METRIC SCORE | RUNNING ES | CORE ENRICHMENT | |
|---|---|---|---|---|---|---|---|
| 1 | PAIP1 | 30 | 12.308 | 0.0752 | Yes | ||
| 2 | EIF3S1 | 57 | 10.656 | 0.1402 | Yes | ||
| 3 | ETF1 | 77 | 9.911 | 0.2010 | Yes | ||
| 4 | PABPC1 | 176 | 8.119 | 0.2470 | Yes | ||
| 5 | EIF3S6 | 201 | 7.694 | 0.2938 | Yes | ||
| 6 | EIF5 | 212 | 7.562 | 0.3403 | Yes | ||
| 7 | EIF4A2 | 356 | 6.429 | 0.3738 | Yes | ||
| 8 | EIF4G3 | 363 | 6.393 | 0.4133 | Yes | ||
| 9 | EIF1AY | 481 | 5.703 | 0.4434 | Yes | ||
| 10 | EIF3S8 | 507 | 5.564 | 0.4768 | Yes | ||
| 11 | EIF3S10 | 536 | 5.426 | 0.5093 | Yes | ||
| 12 | EIF2S2 | 565 | 5.270 | 0.5408 | Yes | ||
| 13 | ITGB4BP | 729 | 4.726 | 0.5627 | Yes | ||
| 14 | WBSCR1 | 832 | 4.467 | 0.5859 | Yes | ||
| 15 | EIF2B1 | 1048 | 3.993 | 0.6009 | Yes | ||
| 16 | EIF4G1 | 1269 | 3.611 | 0.6133 | Yes | ||
| 17 | EEF1A2 | 1614 | 3.196 | 0.6174 | Yes | ||
| 18 | EIF2S1 | 1825 | 3.000 | 0.6265 | Yes | ||
| 19 | EIF5B | 2248 | 2.672 | 0.6239 | No | ||
| 20 | EIF2B3 | 2926 | 2.330 | 0.6074 | No | ||
| 21 | EIF3S9 | 3206 | 2.218 | 0.6085 | No | ||
| 22 | EIF2AK1 | 3918 | 1.952 | 0.5882 | No | ||
| 23 | EIF2AK3 | 4216 | 1.859 | 0.5862 | No | ||
| 24 | EEF1G | 4425 | 1.792 | 0.5878 | No | ||
| 25 | EIF2B2 | 4732 | 1.688 | 0.5844 | No | ||
| 26 | EIF3S5 | 5265 | 1.525 | 0.5695 | No | ||
| 27 | EIF3S7 | 6848 | 1.134 | 0.5044 | No | ||
| 28 | EIF2AK2 | 7236 | 1.043 | 0.4932 | No | ||
| 29 | EIF5A | 7362 | 1.015 | 0.4938 | No | ||
| 30 | EIF3S4 | 8811 | 0.684 | 0.4319 | No | ||
| 31 | GSPT2 | 9662 | 0.477 | 0.3961 | No | ||
| 32 | EIF2B4 | 9997 | 0.382 | 0.3832 | No | ||
| 33 | EIF4EBP1 | 12380 | -0.326 | 0.2765 | No | ||
| 34 | EIF2B5 | 14284 | -0.848 | 0.1949 | No | ||
| 35 | EIF3S3 | 14315 | -0.857 | 0.1988 | No | ||
| 36 | EIF4A1 | 14880 | -1.009 | 0.1794 | No | ||
| 37 | EIF4EBP2 | 15456 | -1.171 | 0.1604 | No | ||
| 38 | EEF1B2 | 15833 | -1.269 | 0.1511 | No | ||
| 39 | EEF1D | 16597 | -1.469 | 0.1254 | No | ||
| 40 | EIF3S2 | 16834 | -1.536 | 0.1242 | No | ||
| 41 | EIF4E | 20471 | -3.243 | -0.0216 | No | ||
| 42 | SLC35A4 | 20545 | -3.304 | -0.0044 | No | ||
| 43 | ANKHD1 | 20667 | -3.418 | 0.0113 | No | ||
| 44 | EEF2K | 20710 | -3.458 | 0.0309 | No | ||
| 45 | EEF2 | 21183 | -4.108 | 0.0349 | No |