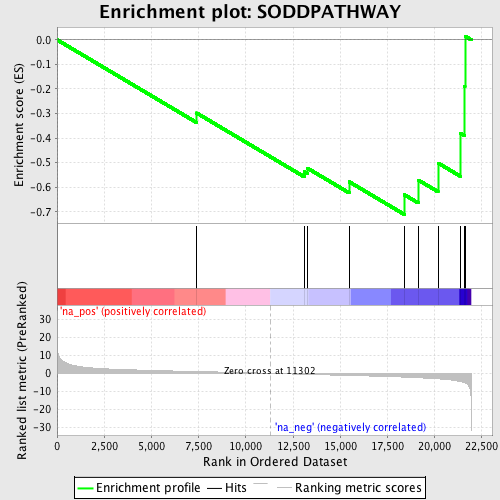
Profile of the Running ES Score & Positions of GeneSet Members on the Rank Ordered List
| Dataset | set01_ATM_minus_versus_SCID |
| Phenotype | NoPhenotypeAvailable |
| Upregulated in class | na_neg |
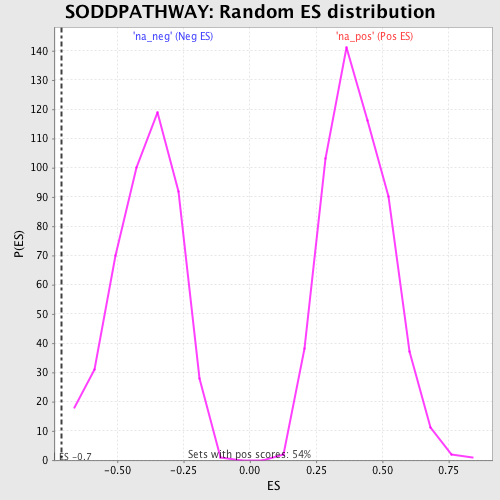
| GeneSet | SODDPATHWAY |
| Enrichment Score (ES) | -0.7111894 |
| Normalized Enrichment Score (NES) | -1.8142776 |
| Nominal p-value | 0.0 |
| FDR q-value | 0.35554257 |
| FWER p-Value | 0.912 |
| PROBE | GENE SYMBOL | GENE_TITLE | RANK IN GENE LIST | RANK METRIC SCORE | RUNNING ES | CORE ENRICHMENT | |
|---|---|---|---|---|---|---|---|
| 1 | TNF | 7390 | 1.007 | -0.2979 | No | ||
| 2 | BIRC3 | 13103 | -0.532 | -0.5377 | No | ||
| 3 | CASP8 | 13264 | -0.577 | -0.5226 | No | ||
| 4 | RIPK1 | 15476 | -1.175 | -0.5779 | No | ||
| 5 | BAG4 | 18401 | -2.080 | -0.6307 | Yes | ||
| 6 | FADD | 19136 | -2.411 | -0.5708 | Yes | ||
| 7 | TNFRSF1B | 20188 | -3.021 | -0.5018 | Yes | ||
| 8 | TRAF2 | 21367 | -4.531 | -0.3801 | Yes | ||
| 9 | TRADD | 21592 | -5.207 | -0.1887 | Yes | ||
| 10 | TNFRSF1A | 21616 | -5.292 | 0.0151 | Yes |