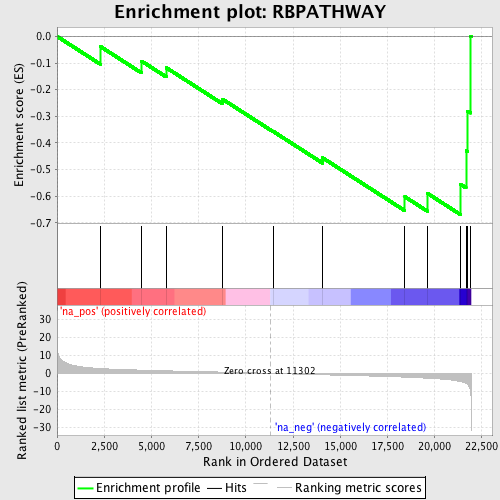
Profile of the Running ES Score & Positions of GeneSet Members on the Rank Ordered List
| Dataset | set01_ATM_minus_versus_SCID |
| Phenotype | NoPhenotypeAvailable |
| Upregulated in class | na_neg |
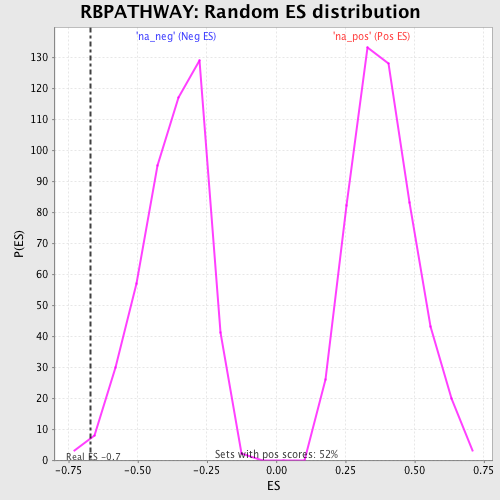
| GeneSet | RBPATHWAY |
| Enrichment Score (ES) | -0.6689791 |
| Normalized Enrichment Score (NES) | -1.8051856 |
| Nominal p-value | 0.008298756 |
| FDR q-value | 0.32257116 |
| FWER p-Value | 0.927 |
| PROBE | GENE SYMBOL | GENE_TITLE | RANK IN GENE LIST | RANK METRIC SCORE | RUNNING ES | CORE ENRICHMENT | |
|---|---|---|---|---|---|---|---|
| 1 | CHEK1 | 2290 | 2.650 | -0.0378 | No | ||
| 2 | CDK4 | 4473 | 1.777 | -0.0926 | No | ||
| 3 | WEE1 | 5782 | 1.386 | -0.1174 | No | ||
| 4 | MYT1 | 8757 | 0.697 | -0.2354 | No | ||
| 5 | CDC25C | 11453 | -0.051 | -0.3570 | No | ||
| 6 | YWHAH | 14065 | -0.795 | -0.4560 | No | ||
| 7 | CDC25A | 18430 | -2.090 | -0.6024 | Yes | ||
| 8 | CDK2 | 19637 | -2.674 | -0.5902 | Yes | ||
| 9 | RB1 | 21366 | -4.526 | -0.5552 | Yes | ||
| 10 | TP53 | 21670 | -5.532 | -0.4300 | Yes | ||
| 11 | CDC25B | 21756 | -6.110 | -0.2803 | Yes | ||
| 12 | ATM | 21922 | -11.494 | 0.0011 | Yes |