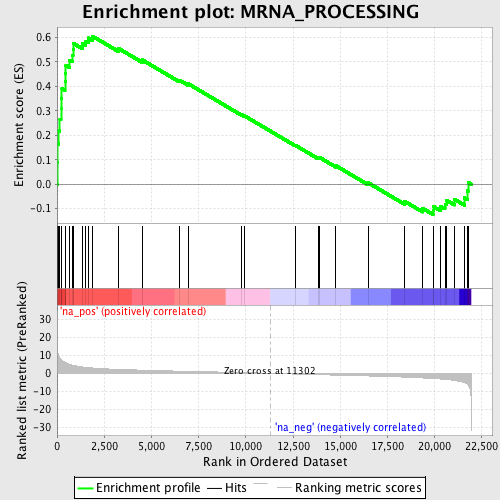
Profile of the Running ES Score & Positions of GeneSet Members on the Rank Ordered List
| Dataset | set01_ATM_minus_versus_SCID |
| Phenotype | NoPhenotypeAvailable |
| Upregulated in class | na_pos |
| GeneSet | MRNA_PROCESSING |
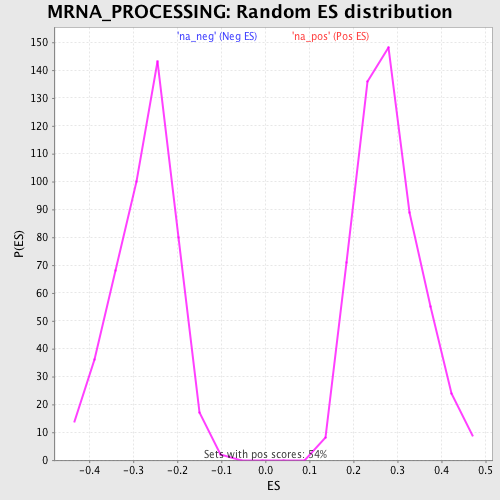
| Enrichment Score (ES) | 0.6055888 |
| Normalized Enrichment Score (NES) | 2.164394 |
| Nominal p-value | 0.0 |
| FDR q-value | 0.0011131116 |
| FWER p-Value | 0.013 |
| PROBE | GENE SYMBOL | GENE_TITLE | RANK IN GENE LIST | RANK METRIC SCORE | RUNNING ES | CORE ENRICHMENT | |
|---|---|---|---|---|---|---|---|
| 1 | SFRS2 | 12 | 15.098 | 0.0878 | Yes | ||
| 2 | SFRS10 | 19 | 13.401 | 0.1660 | Yes | ||
| 3 | SFRS11 | 88 | 9.493 | 0.2184 | Yes | ||
| 4 | SF3A3 | 149 | 8.506 | 0.2655 | Yes | ||
| 5 | SFRS7 | 206 | 7.661 | 0.3078 | Yes | ||
| 6 | HNRPA1 | 209 | 7.587 | 0.3521 | Yes | ||
| 7 | FUSIP1 | 256 | 7.124 | 0.3917 | Yes | ||
| 8 | CPSF6 | 418 | 6.068 | 0.4199 | Yes | ||
| 9 | SMNDC1 | 444 | 5.924 | 0.4534 | Yes | ||
| 10 | ELAVL4 | 466 | 5.799 | 0.4864 | Yes | ||
| 11 | PRPF3 | 660 | 4.925 | 0.5064 | Yes | ||
| 12 | DHX15 | 802 | 4.544 | 0.5266 | Yes | ||
| 13 | SFRS1 | 843 | 4.448 | 0.5508 | Yes | ||
| 14 | HNRPR | 858 | 4.419 | 0.5760 | Yes | ||
| 15 | SFRS2IP | 1335 | 3.513 | 0.5748 | Yes | ||
| 16 | CUGBP1 | 1522 | 3.289 | 0.5856 | Yes | ||
| 17 | SFPQ | 1655 | 3.149 | 0.5980 | Yes | ||
| 18 | SNRPB2 | 1870 | 2.965 | 0.6056 | Yes | ||
| 19 | KHDRBS1 | 3244 | 2.202 | 0.5558 | No | ||
| 20 | HNRPA0 | 4514 | 1.765 | 0.5082 | No | ||
| 21 | SFRS9 | 6490 | 1.219 | 0.4252 | No | ||
| 22 | U2AF1 | 6951 | 1.111 | 0.4107 | No | ||
| 23 | PRPF18 | 9795 | 0.439 | 0.2835 | No | ||
| 24 | LSM5 | 9941 | 0.398 | 0.2792 | No | ||
| 25 | USP39 | 12617 | -0.398 | 0.1594 | No | ||
| 26 | LSM3 | 13827 | -0.731 | 0.1085 | No | ||
| 27 | PRPF8 | 13923 | -0.758 | 0.1086 | No | ||
| 28 | U2AF2 | 14773 | -0.978 | 0.0756 | No | ||
| 29 | SIP1 | 16481 | -1.436 | 0.0061 | No | ||
| 30 | SF3A1 | 18423 | -2.087 | -0.0703 | No | ||
| 31 | SFRS4 | 19374 | -2.533 | -0.0988 | No | ||
| 32 | LSM1 | 19922 | -2.842 | -0.1072 | No | ||
| 33 | PTBP1 | 19927 | -2.846 | -0.0907 | No | ||
| 34 | SNRP70 | 20333 | -3.122 | -0.0909 | No | ||
| 35 | SLBP | 20555 | -3.309 | -0.0816 | No | ||
| 36 | SF3B3 | 20619 | -3.372 | -0.0647 | No | ||
| 37 | SPOP | 21064 | -3.916 | -0.0621 | No | ||
| 38 | SFRS8 | 21582 | -5.193 | -0.0553 | No | ||
| 39 | NONO | 21732 | -5.944 | -0.0273 | No | ||
| 40 | KHSRP | 21778 | -6.332 | 0.0077 | No |