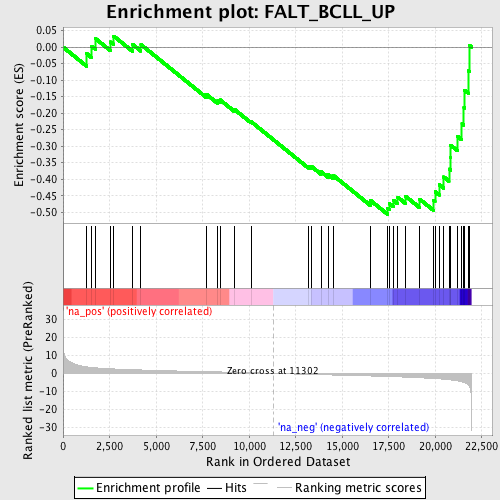
Profile of the Running ES Score & Positions of GeneSet Members on the Rank Ordered List
| Dataset | set01_ATM_minus_versus_SCID |
| Phenotype | NoPhenotypeAvailable |
| Upregulated in class | na_neg |
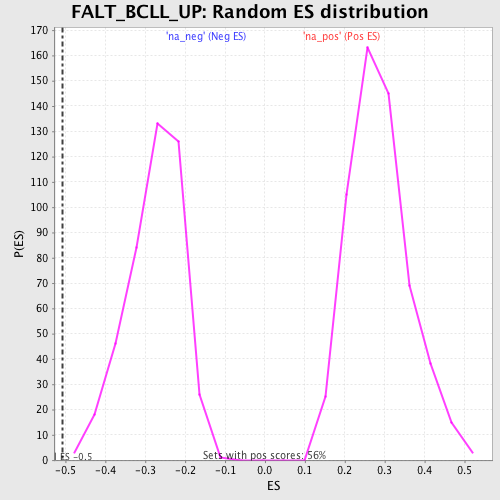
| GeneSet | FALT_BCLL_UP |
| Enrichment Score (ES) | -0.50679076 |
| Normalized Enrichment Score (NES) | -1.8423296 |
| Nominal p-value | 0.0 |
| FDR q-value | 0.34004837 |
| FWER p-Value | 0.836 |
| PROBE | GENE SYMBOL | GENE_TITLE | RANK IN GENE LIST | RANK METRIC SCORE | RUNNING ES | CORE ENRICHMENT | |
|---|---|---|---|---|---|---|---|
| 1 | EIF4G1 | 1269 | 3.611 | -0.0198 | No | ||
| 2 | CALR | 1541 | 3.273 | 0.0024 | No | ||
| 3 | HMGA1 | 1732 | 3.086 | 0.0263 | No | ||
| 4 | PCTK1 | 2545 | 2.513 | 0.0158 | No | ||
| 5 | JARID1C | 2720 | 2.424 | 0.0334 | No | ||
| 6 | SLC7A6 | 3726 | 2.017 | 0.0088 | No | ||
| 7 | VDAC1 | 4182 | 1.868 | 0.0078 | No | ||
| 8 | ENPP2 | 7713 | 0.937 | -0.1434 | No | ||
| 9 | SRC | 8316 | 0.801 | -0.1624 | No | ||
| 10 | SMARCD1 | 8437 | 0.772 | -0.1598 | No | ||
| 11 | STXBP2 | 9220 | 0.588 | -0.1892 | No | ||
| 12 | TK1 | 10102 | 0.354 | -0.2257 | No | ||
| 13 | PRKCSH | 13182 | -0.555 | -0.3604 | No | ||
| 14 | YKT6 | 13336 | -0.600 | -0.3610 | No | ||
| 15 | RGS10 | 13857 | -0.740 | -0.3769 | No | ||
| 16 | E2F4 | 14257 | -0.840 | -0.3863 | No | ||
| 17 | POR | 14535 | -0.916 | -0.3893 | No | ||
| 18 | BAT2 | 16520 | -1.447 | -0.4645 | No | ||
| 19 | ZBTB48 | 17447 | -1.735 | -0.4885 | Yes | ||
| 20 | SAFB | 17541 | -1.765 | -0.4741 | Yes | ||
| 21 | DVL1 | 17759 | -1.838 | -0.4646 | Yes | ||
| 22 | BCR | 17987 | -1.916 | -0.4547 | Yes | ||
| 23 | PKMYT1 | 18405 | -2.081 | -0.4518 | Yes | ||
| 24 | PTPN1 | 19166 | -2.425 | -0.4608 | Yes | ||
| 25 | KCNAB2 | 19895 | -2.825 | -0.4642 | Yes | ||
| 26 | TOP3B | 19985 | -2.881 | -0.4379 | Yes | ||
| 27 | ACTN4 | 20207 | -3.035 | -0.4159 | Yes | ||
| 28 | TYMS | 20456 | -3.229 | -0.3932 | Yes | ||
| 29 | PPP5C | 20735 | -3.488 | -0.3690 | Yes | ||
| 30 | MLH1 | 20819 | -3.588 | -0.3349 | Yes | ||
| 31 | TOMM40 | 20829 | -3.600 | -0.2973 | Yes | ||
| 32 | SBNO2 | 21203 | -4.144 | -0.2706 | Yes | ||
| 33 | UBTF | 21432 | -4.696 | -0.2314 | Yes | ||
| 34 | SMG5 | 21537 | -5.021 | -0.1832 | Yes | ||
| 35 | CNOT3 | 21570 | -5.136 | -0.1304 | Yes | ||
| 36 | ARHGEF1 | 21794 | -6.508 | -0.0719 | Yes | ||
| 37 | MYO9B | 21847 | -7.464 | 0.0046 | Yes |