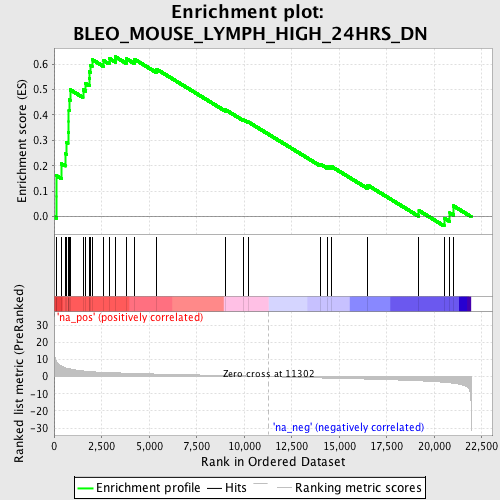
Profile of the Running ES Score & Positions of GeneSet Members on the Rank Ordered List
| Dataset | set01_ATM_minus_versus_SCID |
| Phenotype | NoPhenotypeAvailable |
| Upregulated in class | na_pos |
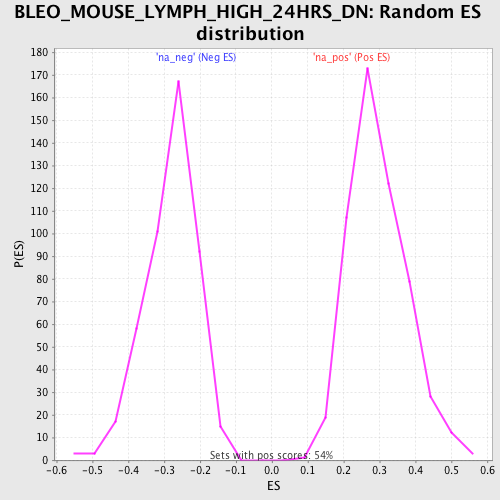
| GeneSet | BLEO_MOUSE_LYMPH_HIGH_24HRS_DN |
| Enrichment Score (ES) | 0.6283256 |
| Normalized Enrichment Score (NES) | 2.1245065 |
| Nominal p-value | 0.0 |
| FDR q-value | 0.0025519235 |
| FWER p-Value | 0.038 |
| PROBE | GENE SYMBOL | GENE_TITLE | RANK IN GENE LIST | RANK METRIC SCORE | RUNNING ES | CORE ENRICHMENT | |
|---|---|---|---|---|---|---|---|
| 1 | PSMD1 | 121 | 8.878 | 0.0782 | Yes | ||
| 2 | GSPT1 | 122 | 8.818 | 0.1614 | Yes | ||
| 3 | BCAP29 | 386 | 6.234 | 0.2081 | Yes | ||
| 4 | NOLC1 | 581 | 5.207 | 0.2484 | Yes | ||
| 5 | TCP1 | 662 | 4.923 | 0.2912 | Yes | ||
| 6 | IDH3A | 731 | 4.716 | 0.3325 | Yes | ||
| 7 | EBNA1BP2 | 779 | 4.608 | 0.3739 | Yes | ||
| 8 | RDX | 781 | 4.605 | 0.4172 | Yes | ||
| 9 | DHX15 | 802 | 4.544 | 0.4592 | Yes | ||
| 10 | SFRS1 | 843 | 4.448 | 0.4993 | Yes | ||
| 11 | SEC61A1 | 1521 | 3.290 | 0.4994 | Yes | ||
| 12 | SFPQ | 1655 | 3.149 | 0.5231 | Yes | ||
| 13 | IFRD1 | 1852 | 2.977 | 0.5422 | Yes | ||
| 14 | SNRPB2 | 1870 | 2.965 | 0.5694 | Yes | ||
| 15 | PPP2CB | 1920 | 2.923 | 0.5947 | Yes | ||
| 16 | SOX4 | 1998 | 2.850 | 0.6181 | Yes | ||
| 17 | ANP32B | 2616 | 2.471 | 0.6132 | Yes | ||
| 18 | C1QBP | 2898 | 2.343 | 0.6225 | Yes | ||
| 19 | RANBP1 | 3228 | 2.211 | 0.6283 | Yes | ||
| 20 | PRMT1 | 3803 | 1.990 | 0.6209 | No | ||
| 21 | HNRPC | 4226 | 1.855 | 0.6191 | No | ||
| 22 | H3F3B | 5398 | 1.490 | 0.5798 | No | ||
| 23 | ATF4 | 9033 | 0.631 | 0.4199 | No | ||
| 24 | GCS1 | 9979 | 0.388 | 0.3804 | No | ||
| 25 | PPM1G | 10221 | 0.321 | 0.3725 | No | ||
| 26 | POLR2C | 14008 | -0.781 | 0.2071 | No | ||
| 27 | FKBP1A | 14387 | -0.874 | 0.1981 | No | ||
| 28 | LMNB1 | 14609 | -0.933 | 0.1968 | No | ||
| 29 | EPRS | 16497 | -1.441 | 0.1243 | No | ||
| 30 | FBL | 19202 | -2.447 | 0.0240 | No | ||
| 31 | UCK2 | 20526 | -3.291 | -0.0054 | No | ||
| 32 | MARK2 | 20828 | -3.598 | 0.0148 | No | ||
| 33 | RAB14 | 21014 | -3.839 | 0.0426 | No |