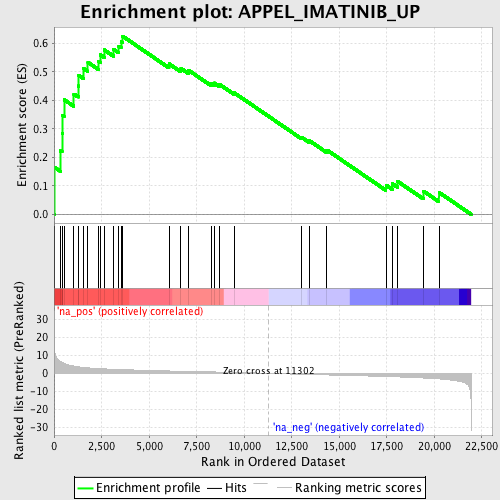
Profile of the Running ES Score & Positions of GeneSet Members on the Rank Ordered List
| Dataset | set01_ATM_minus_versus_SCID |
| Phenotype | NoPhenotypeAvailable |
| Upregulated in class | na_pos |
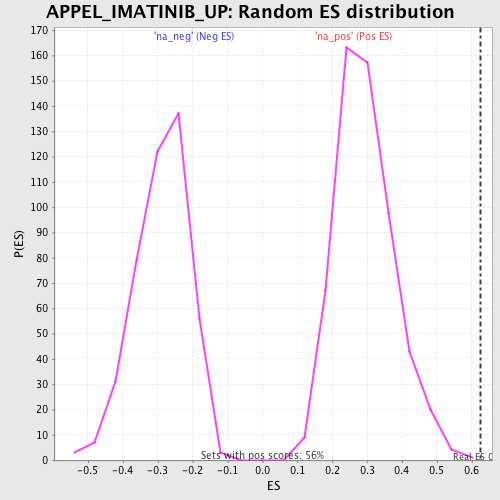
| GeneSet | APPEL_IMATINIB_UP |
| Enrichment Score (ES) | 0.62553173 |
| Normalized Enrichment Score (NES) | 2.119312 |
| Nominal p-value | 0.0017793594 |
| FDR q-value | 0.0024166547 |
| FWER p-Value | 0.04 |
| PROBE | GENE SYMBOL | GENE_TITLE | RANK IN GENE LIST | RANK METRIC SCORE | RUNNING ES | CORE ENRICHMENT | |
|---|---|---|---|---|---|---|---|
| 1 | CTSB | 10 | 15.423 | 0.1657 | Yes | ||
| 2 | LAMP2 | 322 | 6.664 | 0.2233 | Yes | ||
| 3 | FUCA1 | 419 | 6.065 | 0.2842 | Yes | ||
| 4 | PPGB | 436 | 5.968 | 0.3478 | Yes | ||
| 5 | HEXB | 528 | 5.455 | 0.4024 | Yes | ||
| 6 | CTSH | 1040 | 4.007 | 0.4223 | Yes | ||
| 7 | CD300A | 1270 | 3.610 | 0.4507 | Yes | ||
| 8 | ASAH1 | 1298 | 3.560 | 0.4878 | Yes | ||
| 9 | C5AR1 | 1558 | 3.253 | 0.5110 | Yes | ||
| 10 | APOD | 1780 | 3.046 | 0.5338 | Yes | ||
| 11 | APOC1 | 2330 | 2.629 | 0.5371 | Yes | ||
| 12 | MSR1 | 2437 | 2.568 | 0.5599 | Yes | ||
| 13 | OSBPL3 | 2638 | 2.460 | 0.5773 | Yes | ||
| 14 | PPARG | 3135 | 2.246 | 0.5788 | Yes | ||
| 15 | GUSB | 3406 | 2.139 | 0.5895 | Yes | ||
| 16 | APOE | 3527 | 2.091 | 0.6066 | Yes | ||
| 17 | CD68 | 3600 | 2.064 | 0.6255 | Yes | ||
| 18 | CD163 | 6047 | 1.324 | 0.5282 | No | ||
| 19 | GBA | 6673 | 1.177 | 0.5123 | No | ||
| 20 | CTSZ | 7079 | 1.080 | 0.5055 | No | ||
| 21 | PLD1 | 8261 | 0.811 | 0.4603 | No | ||
| 22 | RARRES1 | 8429 | 0.774 | 0.4611 | No | ||
| 23 | HEXA | 8690 | 0.715 | 0.4569 | No | ||
| 24 | PLSCR1 | 9477 | 0.529 | 0.4267 | No | ||
| 25 | ACP5 | 13001 | -0.505 | 0.2714 | No | ||
| 26 | ENG | 13429 | -0.630 | 0.2587 | No | ||
| 27 | NEU1 | 14359 | -0.869 | 0.2257 | No | ||
| 28 | CTSD | 17466 | -1.742 | 0.1027 | No | ||
| 29 | CTSL | 17801 | -1.850 | 0.1074 | No | ||
| 30 | GM2A | 18081 | -1.952 | 0.1157 | No | ||
| 31 | GNS | 19433 | -2.564 | 0.0817 | No | ||
| 32 | LAMP1 | 20255 | -3.062 | 0.0772 | No |