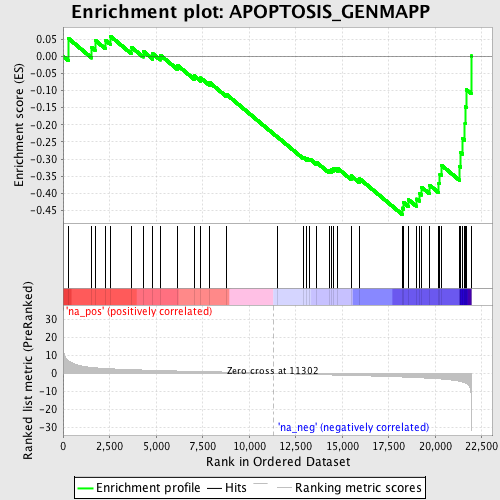
Profile of the Running ES Score & Positions of GeneSet Members on the Rank Ordered List
| Dataset | set01_ATM_minus_versus_SCID |
| Phenotype | NoPhenotypeAvailable |
| Upregulated in class | na_neg |
| GeneSet | APOPTOSIS_GENMAPP |
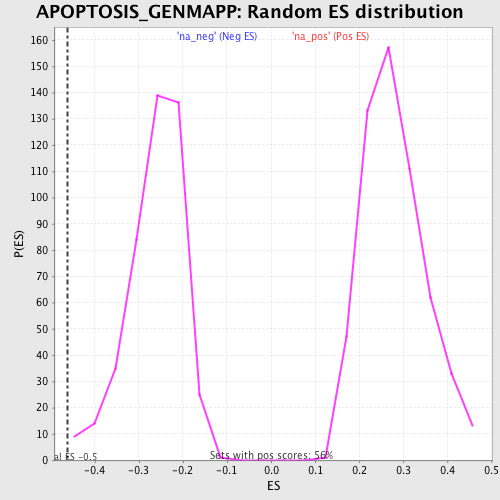
| Enrichment Score (ES) | -0.4619127 |
| Normalized Enrichment Score (NES) | -1.7642179 |
| Nominal p-value | 0.0022573364 |
| FDR q-value | 0.25510484 |
| FWER p-Value | 0.974 |
| PROBE | GENE SYMBOL | GENE_TITLE | RANK IN GENE LIST | RANK METRIC SCORE | RUNNING ES | CORE ENRICHMENT | |
|---|---|---|---|---|---|---|---|
| 1 | CYCS | 295 | 6.886 | 0.0518 | No | ||
| 2 | BID | 1540 | 3.273 | 0.0260 | No | ||
| 3 | MAP2K4 | 1720 | 3.094 | 0.0471 | No | ||
| 4 | NFKB1 | 2265 | 2.665 | 0.0475 | No | ||
| 5 | MAPK10 | 2538 | 2.517 | 0.0589 | No | ||
| 6 | BAX | 3661 | 2.040 | 0.0270 | No | ||
| 7 | TNFSF10 | 4300 | 1.829 | 0.0152 | No | ||
| 8 | MYC | 4818 | 1.663 | 0.0074 | No | ||
| 9 | JUN | 5219 | 1.538 | 0.0037 | No | ||
| 10 | PRF1 | 6136 | 1.301 | -0.0258 | No | ||
| 11 | CASP3 | 7041 | 1.089 | -0.0567 | No | ||
| 12 | TNF | 7390 | 1.007 | -0.0631 | No | ||
| 13 | APAF1 | 7858 | 0.905 | -0.0758 | No | ||
| 14 | TRAF1 | 8756 | 0.697 | -0.1102 | No | ||
| 15 | BIRC2 | 11518 | -0.071 | -0.2355 | No | ||
| 16 | GZMB | 12914 | -0.481 | -0.2947 | No | ||
| 17 | BIRC3 | 13103 | -0.532 | -0.2982 | No | ||
| 18 | CASP8 | 13264 | -0.577 | -0.3000 | No | ||
| 19 | FASLG | 13618 | -0.676 | -0.3098 | No | ||
| 20 | MAP3K14 | 14291 | -0.850 | -0.3324 | No | ||
| 21 | NFKBIA | 14429 | -0.885 | -0.3303 | No | ||
| 22 | BIRC4 | 14539 | -0.916 | -0.3265 | No | ||
| 23 | FAS | 14741 | -0.969 | -0.3265 | No | ||
| 24 | RIPK1 | 15476 | -1.175 | -0.3489 | No | ||
| 25 | MCL1 | 15927 | -1.291 | -0.3572 | No | ||
| 26 | MAP3K1 | 18221 | -2.003 | -0.4429 | Yes | ||
| 27 | BCL2L1 | 18302 | -2.040 | -0.4273 | Yes | ||
| 28 | MDM2 | 18548 | -2.138 | -0.4182 | Yes | ||
| 29 | RELA | 19001 | -2.341 | -0.4167 | Yes | ||
| 30 | FADD | 19136 | -2.411 | -0.3999 | Yes | ||
| 31 | PARP1 | 19253 | -2.476 | -0.3818 | Yes | ||
| 32 | IKBKG | 19692 | -2.704 | -0.3761 | Yes | ||
| 33 | TNFRSF1B | 20188 | -3.021 | -0.3701 | Yes | ||
| 34 | CASP2 | 20246 | -3.056 | -0.3438 | Yes | ||
| 35 | CASP9 | 20330 | -3.121 | -0.3180 | Yes | ||
| 36 | CASP6 | 21299 | -4.360 | -0.3209 | Yes | ||
| 37 | TRAF2 | 21367 | -4.531 | -0.2810 | Yes | ||
| 38 | BCL2 | 21470 | -4.794 | -0.2403 | Yes | ||
| 39 | TRADD | 21592 | -5.207 | -0.1965 | Yes | ||
| 40 | TNFRSF1A | 21616 | -5.292 | -0.1474 | Yes | ||
| 41 | TP53 | 21670 | -5.532 | -0.0974 | Yes | ||
| 42 | CASP7 | 21924 | -11.616 | 0.0010 | Yes |